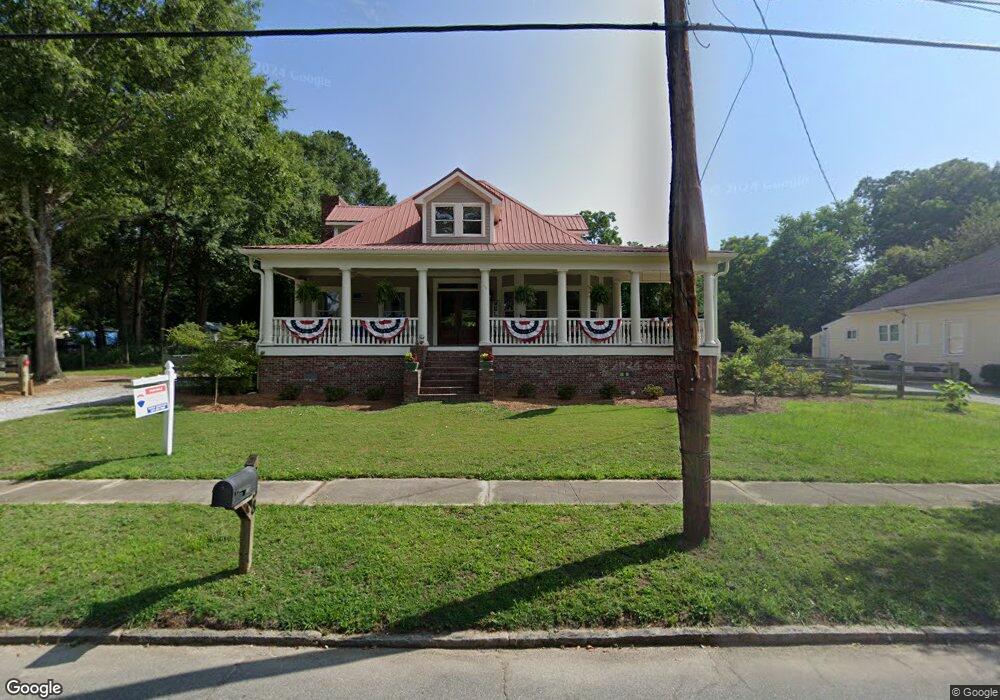
138 W Main St Rutledge, GA 30663
Estimated Value: $586,000 - $784,000
4
Beds
4
Baths
3,750
Sq Ft
$184/Sq Ft
Est. Value
About This Home
This home is located at 138 W Main St, Rutledge, GA 30663 and is currently estimated at $691,502, approximately $184 per square foot. 138 W Main St is a home located in Morgan County with nearby schools including Morgan County Primary School, Morgan County Elementary School, and Morgan County Middle School.
Ownership History
Date
Name
Owned For
Owner Type
Purchase Details
Closed on
Mar 28, 2024
Sold by
Knight Spencer
Bought by
Sullivan Patrick C
Current Estimated Value
Home Financials for this Owner
Home Financials are based on the most recent Mortgage that was taken out on this home.
Original Mortgage
$652,955
Outstanding Balance
$641,507
Interest Rate
6.94%
Mortgage Type
New Conventional
Estimated Equity
$49,995
Purchase Details
Closed on
May 31, 2007
Sold by
Park Properties Of Georgia
Bought by
Knight Spencer
Home Financials for this Owner
Home Financials are based on the most recent Mortgage that was taken out on this home.
Original Mortgage
$346,000
Interest Rate
6.12%
Mortgage Type
New Conventional
Purchase Details
Closed on
Mar 31, 2005
Sold by
Knight R Wyatt
Bought by
Park Properties Of Georgia Llc
Purchase Details
Closed on
Dec 23, 2003
Sold by
City Of Rutledge
Bought by
Knight R Wyatt
Purchase Details
Closed on
Oct 11, 1993
Sold by
Bankston Edward
Bought by
City Of Rutledge
Create a Home Valuation Report for This Property
The Home Valuation Report is an in-depth analysis detailing your home's value as well as a comparison with similar homes in the area
Home Values in the Area
Average Home Value in this Area
Purchase History
| Date | Buyer | Sale Price | Title Company |
|---|---|---|---|
| Sullivan Patrick C | $665,000 | -- | |
| Knight Spencer | $519,000 | -- | |
| Park Properties Of Georgia Llc | -- | -- | |
| Knight R Wyatt | $22,000 | -- | |
| City Of Rutledge | -- | -- |
Source: Public Records
Mortgage History
| Date | Status | Borrower | Loan Amount |
|---|---|---|---|
| Open | Sullivan Patrick C | $652,955 | |
| Previous Owner | Knight Spencer | $346,000 |
Source: Public Records
Tax History
| Year | Tax Paid | Tax Assessment Tax Assessment Total Assessment is a certain percentage of the fair market value that is determined by local assessors to be the total taxable value of land and additions on the property. | Land | Improvement |
|---|---|---|---|---|
| 2025 | $6,268 | $277,042 | $15,200 | $261,842 |
| 2024 | $6,369 | $248,601 | $15,200 | $233,401 |
| 2023 | $5,586 | $211,765 | $13,600 | $198,165 |
| 2022 | $5,014 | $183,036 | $13,600 | $169,436 |
| 2021 | $4,669 | $169,864 | $8,000 | $161,864 |
| 2020 | $4,659 | $167,864 | $6,000 | $161,864 |
| 2019 | $4,730 | $167,864 | $6,000 | $161,864 |
| 2018 | $4,798 | $167,864 | $6,000 | $161,864 |
| 2017 | $4,920 | $167,896 | $6,000 | $161,896 |
| 2016 | $4,386 | $147,446 | $6,000 | $141,446 |
| 2015 | $4,443 | $147,280 | $4,000 | $143,280 |
| 2014 | $3,837 | $130,520 | $4,000 | $126,520 |
| 2013 | -- | $99,440 | $4,000 | $95,440 |
Source: Public Records
Map
Nearby Homes
- 160 Fairplay St
- 224 Hollis St
- 178 Fairplay St
- 120 Hidden Falls Ct
- 203 E Dixie Hwy
- 234 E Main St
- 0 Hawkins Academy Rd Unit 10561655
- 5761 W Dixie Hwy
- 305 Fairplay St
- 5521 Atlanta Hwy
- 294 Tuscany Dr
- 1051 Lake Rutledge Rd
- 2791 Old Mill Rd
- 542 Indian Creek Trail
- 4610 Atlanta Hwy
- 0 W Dixie Hwy Unit 10499573
- 5841 Atlanta Hwy
- 1041 Cooper Ln
- 3320 Davis Academy Rd
- 3195 Davis Academy Rd
- 134 W Main St
- 164 W Main St
- 170 W Main St
- 144 W Main St
- 147 Mcdonough St
- 157 Mcdonough St
- 130 W Main St
- 145 W Main St
- 141 Mcdonough St
- 135 W Main St
- 153 Mcdonough St
- 0 Mc Donough St
- 119 Church St
- 120 W Main St
- 107 Church St
- 158 Mc Donough St
- 131 W Main St
- 161 Mcdonough St
- 150 Mcdonough St
- 166 Mcdonough St
Your Personal Tour Guide
Ask me questions while you tour the home.