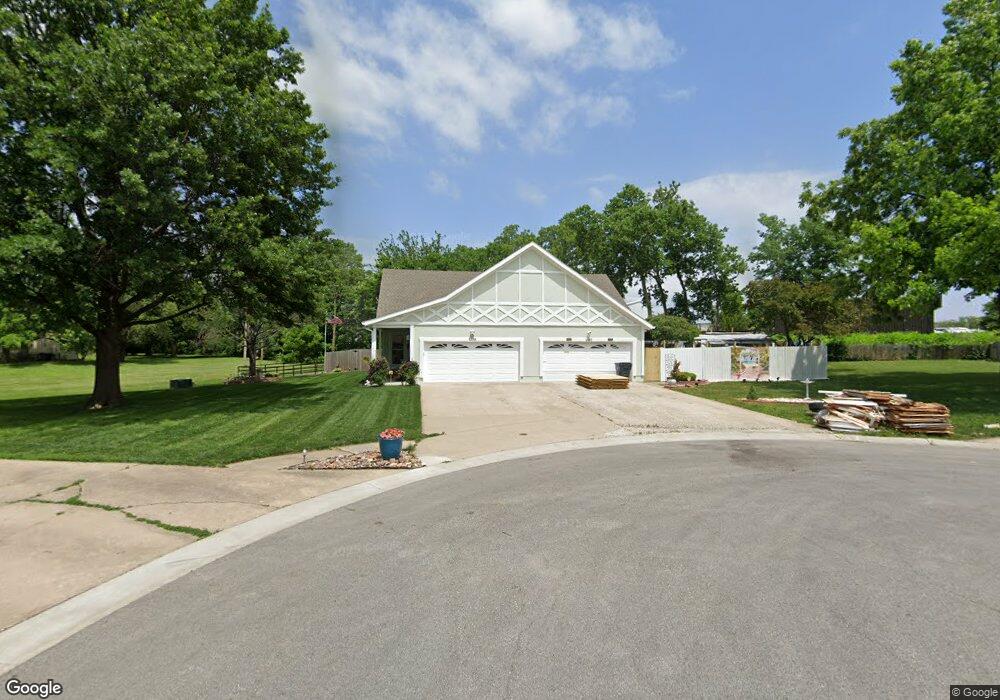
1380 N Northridge Pkwy Olathe, KS 66061
Estimated Value: $267,000 - $303,486
3
Beds
3
Baths
1,498
Sq Ft
$188/Sq Ft
Est. Value
About This Home
This home is located at 1380 N Northridge Pkwy, Olathe, KS 66061 and is currently estimated at $282,372, approximately $188 per square foot. 1380 N Northridge Pkwy is a home located in Johnson County with nearby schools including Washington Elementary School, Santa Fe Trail Middle School, and Olathe North Sr High School.
Ownership History
Date
Name
Owned For
Owner Type
Purchase Details
Closed on
Mar 29, 2011
Sold by
Lyon Timothy J and Lyon Brenda S
Bought by
Sellen Maritta and Lyon Timothy J
Current Estimated Value
Home Financials for this Owner
Home Financials are based on the most recent Mortgage that was taken out on this home.
Original Mortgage
$107,100
Outstanding Balance
$74,508
Interest Rate
4.98%
Mortgage Type
New Conventional
Estimated Equity
$207,864
Purchase Details
Closed on
Jan 7, 2009
Sold by
Lyon Timothy J and Lyon Brenda S
Bought by
Lyon Timothy J and Lyon Brenda S
Purchase Details
Closed on
Oct 2, 2002
Sold by
Dreyer Barbara J
Bought by
Lyon Timothy J and Lyon Brenda S
Home Financials for this Owner
Home Financials are based on the most recent Mortgage that was taken out on this home.
Original Mortgage
$125,400
Interest Rate
6.2%
Create a Home Valuation Report for This Property
The Home Valuation Report is an in-depth analysis detailing your home's value as well as a comparison with similar homes in the area
Home Values in the Area
Average Home Value in this Area
Purchase History
| Date | Buyer | Sale Price | Title Company |
|---|---|---|---|
| Sellen Maritta | -- | Kansas City Title Inc | |
| Lyon Timothy J | -- | None Available | |
| Lyon Timothy J | -- | Chicago Title Insurance Co |
Source: Public Records
Mortgage History
| Date | Status | Borrower | Loan Amount |
|---|---|---|---|
| Open | Sellen Maritta | $107,100 | |
| Closed | Lyon Timothy J | $125,400 |
Source: Public Records
Tax History Compared to Growth
Tax History
| Year | Tax Paid | Tax Assessment Tax Assessment Total Assessment is a certain percentage of the fair market value that is determined by local assessors to be the total taxable value of land and additions on the property. | Land | Improvement |
|---|---|---|---|---|
| 2024 | $2,867 | $26,105 | $3,380 | $22,725 |
| 2023 | $2,813 | $24,864 | $3,071 | $21,793 |
| 2022 | $2,547 | $21,930 | $2,556 | $19,374 |
| 2021 | $2,465 | $20,090 | $2,556 | $17,534 |
| 2020 | $2,345 | $18,952 | $2,221 | $16,731 |
| 2019 | $2,234 | $17,952 | $2,220 | $15,732 |
| 2018 | $2,030 | $16,227 | $1,932 | $14,295 |
| 2017 | $1,857 | $14,720 | $1,755 | $12,965 |
| 2016 | $1,696 | $13,812 | $1,755 | $12,057 |
| 2015 | $1,710 | $13,926 | $1,596 | $12,330 |
| 2013 | -- | $12,546 | $1,490 | $11,056 |
Source: Public Records
Map
Nearby Homes
- 1267 N Petzold Units A B C D Dr
- 1305 E 123rd Terrace Unit B
- 1416 E 125th Terrace Unit B
- 976 E 120th St
- 968 E 120th St
- 960 E 120th St
- 952 E 120th St
- 944 E 120th St
- 936 E 120th St
- 928 E 120th St
- 920 E 120th St
- 912 E 120th St
- 904 E 120th St
- 1021 E Pineview St
- 16604 W 125th St
- No Address W 119th St
- 968 E Cavendish Trail
- 1012 N Hunter Dr
- 1350 N Prince Edward Island St
- 1121 N Julia St
- 1380 N Ridge Pkwy
- 1378 N Northridge Pkwy
- 1374 N Northridge Pkwy
- 1382 N Northridge Pkwy
- 1376 N Northridge Pkwy
- 1376 N Ridge Pkwy
- 1382 N Ridge Pkwy
- 1370 N Northridge Pkwy
- 1370 N Ridge Pkwy
- 1384 N Northridge Pkwy
- 1388 N Ridge Pkwy
- 1388 N Northridge Pkwy
- 1372 N Northridge Pkwy
- 1386 N Northridge Pkwy
- 1366 N Northridge Pkwy
- 1530 E 123rd St
- 1368 N Northridge Pkwy
- 1375 N Winchester St
- 1368 N Ridge Pkwy
- 1362 N Northridge Pkwy