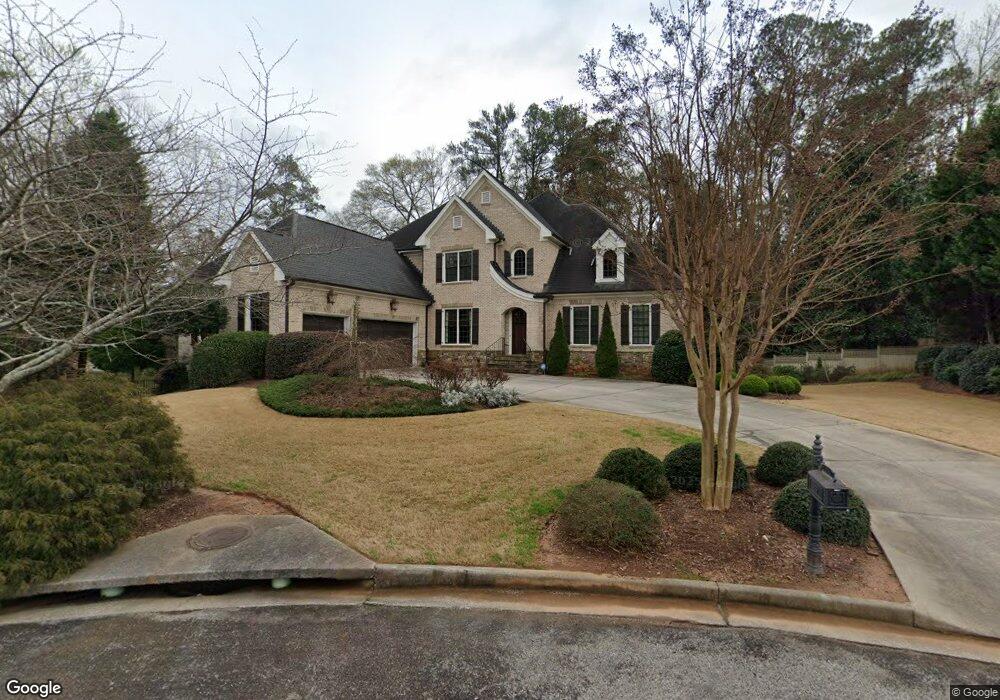
1380 Stonegate Ln SE Smyrna, GA 30080
Estimated Value: $956,000 - $1,402,000
4
Beds
4
Baths
3,949
Sq Ft
$282/Sq Ft
Est. Value
About This Home
This home is located at 1380 Stonegate Ln SE, Smyrna, GA 30080 and is currently estimated at $1,113,920, approximately $282 per square foot. 1380 Stonegate Ln SE is a home located in Cobb County with nearby schools including Smyrna Elementary School, Campbell Middle School, and Campbell High School.
Ownership History
Date
Name
Owned For
Owner Type
Purchase Details
Closed on
Dec 20, 2010
Sold by
Hope Pamela and Hope Mark
Bought by
Hope Pamela S and Hope Mark A
Current Estimated Value
Home Financials for this Owner
Home Financials are based on the most recent Mortgage that was taken out on this home.
Original Mortgage
$250,000
Outstanding Balance
$3,784
Interest Rate
4.42%
Mortgage Type
New Conventional
Estimated Equity
$1,110,136
Purchase Details
Closed on
Jun 22, 2009
Sold by
Us Bank Na
Bought by
Hope Mark and Hope Pamela
Home Financials for this Owner
Home Financials are based on the most recent Mortgage that was taken out on this home.
Original Mortgage
$324,900
Interest Rate
4.79%
Mortgage Type
New Conventional
Purchase Details
Closed on
Apr 7, 2009
Sold by
Flanders Mark C
Bought by
Us Bank Na
Purchase Details
Closed on
Jul 28, 2006
Sold by
John Willis Homes Inc
Bought by
Flanders Mark C
Home Financials for this Owner
Home Financials are based on the most recent Mortgage that was taken out on this home.
Original Mortgage
$748,967
Interest Rate
6.68%
Mortgage Type
New Conventional
Create a Home Valuation Report for This Property
The Home Valuation Report is an in-depth analysis detailing your home's value as well as a comparison with similar homes in the area
Home Values in the Area
Average Home Value in this Area
Purchase History
| Date | Buyer | Sale Price | Title Company |
|---|---|---|---|
| Hope Pamela S | -- | -- | |
| Hope Mark | $474,900 | -- | |
| Us Bank Na | $650,000 | -- | |
| Flanders Mark C | $788,400 | -- |
Source: Public Records
Mortgage History
| Date | Status | Borrower | Loan Amount |
|---|---|---|---|
| Open | Hope Pamela S | $250,000 | |
| Previous Owner | Hope Mark | $324,900 | |
| Previous Owner | Flanders Mark C | $748,967 |
Source: Public Records
Tax History Compared to Growth
Tax History
| Year | Tax Paid | Tax Assessment Tax Assessment Total Assessment is a certain percentage of the fair market value that is determined by local assessors to be the total taxable value of land and additions on the property. | Land | Improvement |
|---|---|---|---|---|
| 2025 | $2,557 | $388,396 | $100,000 | $288,396 |
| 2024 | $2,557 | $355,108 | $90,000 | $265,108 |
| 2023 | $2,405 | $355,108 | $90,000 | $265,108 |
| 2022 | $2,557 | $355,108 | $90,000 | $265,108 |
| 2021 | $2,394 | $288,560 | $90,000 | $198,560 |
| 2020 | $2,394 | $288,560 | $90,000 | $198,560 |
| 2019 | $7,659 | $288,560 | $90,000 | $198,560 |
| 2018 | $7,573 | $285,424 | $80,000 | $205,424 |
| 2017 | $7,104 | $285,424 | $80,000 | $205,424 |
| 2016 | $7,105 | $285,424 | $80,000 | $205,424 |
| 2015 | $5,125 | $204,000 | $63,164 | $140,836 |
| 2014 | $5,174 | $204,000 | $0 | $0 |
Source: Public Records
Map
Nearby Homes
- 1460 Memory Ln SE
- 1483 Collier Dr SE
- 3324 Pretty Branch Dr SE
- 3028 Montclair Cir SE
- 3018 Montclair Cir SE Unit 57
- 3211 Collier Gate Ct SE
- 3064 Montclair Cir SE
- 1203 Vinings Forest Ln SE Unit 12
- 1303 Vinings Forest Ln SE
- 1652 Mosaic Way
- 812 Vinings Forest Ln SE Unit 812
- 3230 Collier Gate Ct SE
- 1582 Mosaic Way Unit 1582
- 3364 Dunn St SE
- 3086 Nichols St SE
- 1552 Mosaic Way
- 1560 Mosaic Way
- 1370 Stonegate Ln SE Unit 6
- 1370 Stonegate Ln SE Unit 557
- 3174 Northview Place SE
- 3184 Northview Place SE
- 3162 Northview Place SE
- 1375 Stonegate Ln SE
- 3183 Lee St SE
- 0 Stonegate Ln SE Unit 7426841
- 0 Stonegate Ln SE Unit 8590411
- 0 Stonegate Ln SE Unit 8475859
- 0 Stonegate Ln SE Unit 8357564
- 0 Stonegate Ln SE Unit 7620958
- 0 Stonegate Ln SE Unit 7581229
- 0 Stonegate Ln SE Unit 8949106
- 0 Stonegate Ln SE
- 1360 Stonegate Ln SE
- 3150 Northview Place SE
- 0 Northview Place SE
- 3194 Northview Place SE