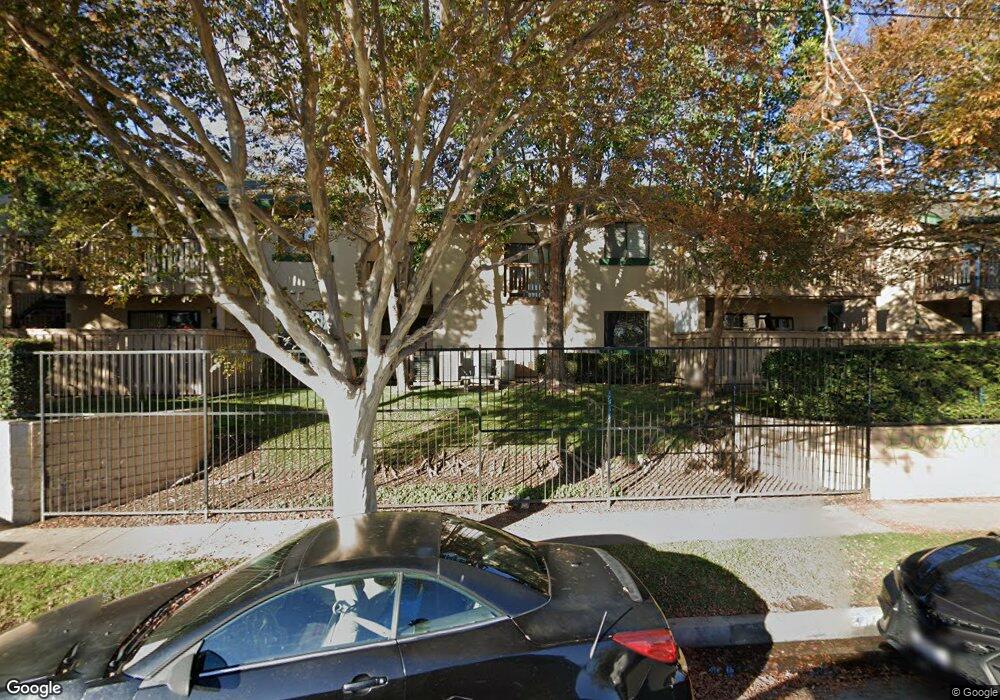
13801 Shirley St Unit 78 Garden Grove, CA 92843
Estimated Value: $495,000 - $706,000
2
Beds
2
Baths
830
Sq Ft
$676/Sq Ft
Est. Value
About This Home
This home is located at 13801 Shirley St Unit 78, Garden Grove, CA 92843 and is currently estimated at $560,881, approximately $675 per square foot. 13801 Shirley St Unit 78 is a home located in Orange County with nearby schools including Woodbury Elementary School, James Irvine Intermediate School, and Bolsa Grande High School.
Ownership History
Date
Name
Owned For
Owner Type
Purchase Details
Closed on
Apr 6, 2004
Sold by
Tran Tony G
Bought by
Velasquez Diana Z
Current Estimated Value
Home Financials for this Owner
Home Financials are based on the most recent Mortgage that was taken out on this home.
Original Mortgage
$154,000
Interest Rate
5.35%
Mortgage Type
Stand Alone First
Purchase Details
Closed on
Oct 24, 2001
Sold by
Iberri Aleida and Iberri Enrique
Bought by
Tran Tony G
Home Financials for this Owner
Home Financials are based on the most recent Mortgage that was taken out on this home.
Original Mortgage
$148,650
Interest Rate
6.57%
Purchase Details
Closed on
Mar 22, 2000
Sold by
Blume Bryan M and Blume Gina M
Bought by
Iberri Enrique and Iberri Aleida
Home Financials for this Owner
Home Financials are based on the most recent Mortgage that was taken out on this home.
Original Mortgage
$94,720
Interest Rate
9.62%
Create a Home Valuation Report for This Property
The Home Valuation Report is an in-depth analysis detailing your home's value as well as a comparison with similar homes in the area
Home Values in the Area
Average Home Value in this Area
Purchase History
| Date | Buyer | Sale Price | Title Company |
|---|---|---|---|
| Velasquez Diana Z | $280,000 | -- | |
| Tran Tony G | $156,500 | Orange Coast Title | |
| Iberri Enrique | $118,500 | Orange Coast Title |
Source: Public Records
Mortgage History
| Date | Status | Borrower | Loan Amount |
|---|---|---|---|
| Previous Owner | Velasquez Diana Z | $154,000 | |
| Previous Owner | Tran Tony G | $148,650 | |
| Previous Owner | Iberri Enrique | $94,720 | |
| Closed | Iberri Enrique | $23,680 |
Source: Public Records
Tax History Compared to Growth
Tax History
| Year | Tax Paid | Tax Assessment Tax Assessment Total Assessment is a certain percentage of the fair market value that is determined by local assessors to be the total taxable value of land and additions on the property. | Land | Improvement |
|---|---|---|---|---|
| 2025 | $4,992 | $398,091 | $285,030 | $113,061 |
| 2024 | $4,992 | $390,286 | $279,441 | $110,845 |
| 2023 | $4,899 | $382,634 | $273,962 | $108,672 |
| 2022 | $4,633 | $362,100 | $268,590 | $93,510 |
| 2021 | $4,567 | $355,000 | $263,324 | $91,676 |
| 2020 | $4,196 | $325,000 | $238,918 | $86,082 |
| 2019 | $4,216 | $325,000 | $238,918 | $86,082 |
| 2018 | $3,878 | $299,000 | $212,918 | $86,082 |
| 2017 | $3,907 | $299,000 | $212,918 | $86,082 |
| 2016 | $3,479 | $273,000 | $186,918 | $86,082 |
| 2015 | $3,118 | $242,000 | $155,918 | $86,082 |
| 2014 | $2,553 | $195,050 | $108,968 | $86,082 |
Source: Public Records
Map
Nearby Homes
- 13801 Shirley St Unit 25
- 11321 Parkgreen Ln Unit 102
- 13621 Malibu St
- 1609 N Parsons Place
- 10866 Westminster Ave Unit 10
- 10866 Westminster Ave Unit 1
- 5010 W Maurie Ave
- 13322 Euclid St
- 13312 Michael Rainford Cir
- 14151 Lake St
- 14356 Taft St
- 13372 Jessica Dr
- 4213 Fay Cir
- 1416 N Harbor Blvd Unit 6
- 526 W Tribella Ct
- 5317 Silver Dr
- 12970 Newhope St
- 10422 Bonnie Dr
- 13052 Rockinghorse Rd
- 10391 Mildred Ave
- 13801 Shirley St
- 13801 Shirley St Unit 62
- 13801 Shirley St Unit 44
- 13801 Shirley St Unit 34
- 13801 Shirley St Unit 86
- 13801 Shirley St Unit 1
- 13801 Shirley St Unit 53
- 13801 Shirley St Unit 59
- 13801 Shirley St Unit 67
- 13801 Shirley St Unit 76
- 13801 Shirley St Unit 63
- 13801 Shirley St Unit 88
- 13801 Shirley St Unit 43
- 13801 Shirley St Unit 30
- 13801 Shirley St Unit 48
- 13801 Shirley St Unit 74
- 13801 Shirley St Unit 31
- 13801 Shirley St Unit 2
- 13801 Shirley St Unit 14
- 13801 Shirley St Unit 47