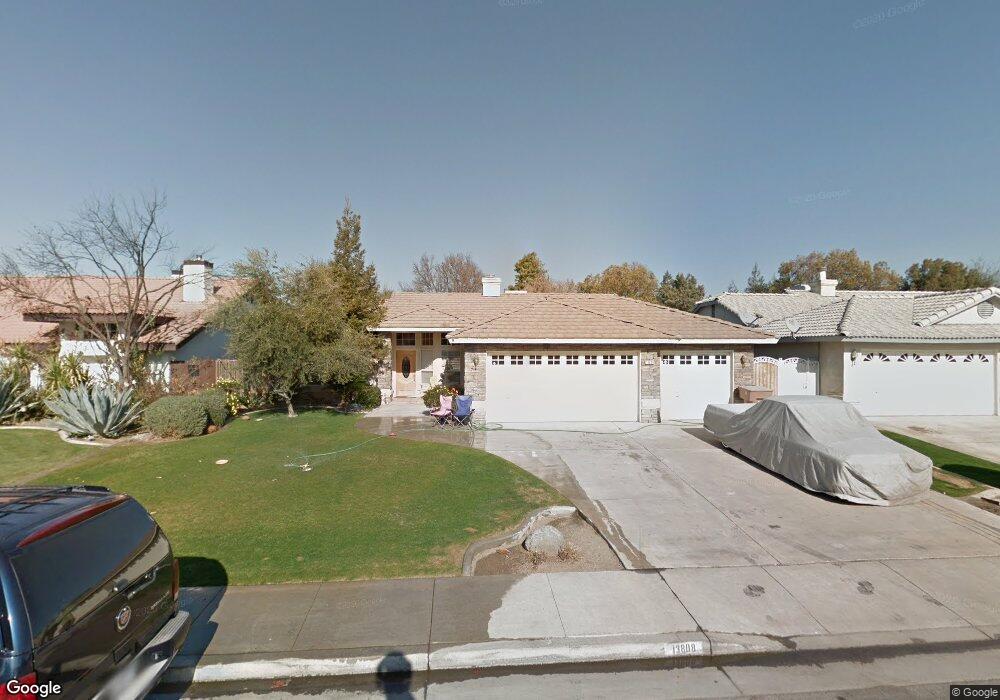
13808 Via Contento Bakersfield, CA 93314
Estimated Value: $383,000 - $454,000
3
Beds
2
Baths
1,433
Sq Ft
$286/Sq Ft
Est. Value
About This Home
This home is located at 13808 Via Contento, Bakersfield, CA 93314 and is currently estimated at $410,116, approximately $286 per square foot. 13808 Via Contento is a home located in Kern County with nearby schools including Del Rio Elementary School, Rosedale Middle School, and Liberty High School.
Ownership History
Date
Name
Owned For
Owner Type
Purchase Details
Closed on
Jan 4, 2001
Sold by
Vella Patricia C
Bought by
Vella Joseph C
Current Estimated Value
Purchase Details
Closed on
Aug 18, 1999
Sold by
Hud
Bought by
Vella Joseph C and Vella Patricia C
Home Financials for this Owner
Home Financials are based on the most recent Mortgage that was taken out on this home.
Original Mortgage
$85,050
Outstanding Balance
$24,402
Interest Rate
7.63%
Estimated Equity
$385,714
Purchase Details
Closed on
Sep 29, 1998
Sold by
Chemical Mtg Company
Bought by
Hud
Purchase Details
Closed on
Oct 5, 1995
Sold by
Carriage Homes
Bought by
Stelow Lawrence Michael
Home Financials for this Owner
Home Financials are based on the most recent Mortgage that was taken out on this home.
Original Mortgage
$119,939
Interest Rate
7.51%
Mortgage Type
FHA
Create a Home Valuation Report for This Property
The Home Valuation Report is an in-depth analysis detailing your home's value as well as a comparison with similar homes in the area
Home Values in the Area
Average Home Value in this Area
Purchase History
| Date | Buyer | Sale Price | Title Company |
|---|---|---|---|
| Vella Joseph C | -- | -- | |
| Vella Joseph C | $115,500 | American Title Co | |
| Hud | -- | -- | |
| Chase Mtg Company | $124,141 | Fidelity National Title | |
| Stelow Lawrence Michael | $121,000 | First American Title Ins Co |
Source: Public Records
Mortgage History
| Date | Status | Borrower | Loan Amount |
|---|---|---|---|
| Open | Vella Joseph C | $85,050 | |
| Previous Owner | Stelow Lawrence Michael | $119,939 |
Source: Public Records
Tax History
| Year | Tax Paid | Tax Assessment Tax Assessment Total Assessment is a certain percentage of the fair market value that is determined by local assessors to be the total taxable value of land and additions on the property. | Land | Improvement |
|---|---|---|---|---|
| 2025 | $3,366 | $177,492 | $53,780 | $123,712 |
| 2024 | $3,288 | $174,013 | $52,726 | $121,287 |
| 2023 | $3,288 | $170,602 | $51,693 | $118,909 |
| 2022 | $3,216 | $167,258 | $50,680 | $116,578 |
| 2021 | $3,087 | $163,980 | $49,687 | $114,293 |
| 2020 | $3,023 | $162,300 | $49,178 | $113,122 |
| 2019 | $2,969 | $162,300 | $49,178 | $113,122 |
| 2018 | $2,905 | $155,999 | $47,269 | $108,730 |
| 2017 | $2,858 | $152,942 | $46,343 | $106,599 |
| 2016 | $2,728 | $149,944 | $45,435 | $104,509 |
| 2015 | $2,680 | $147,693 | $44,753 | $102,940 |
| 2014 | $2,621 | $144,801 | $43,877 | $100,924 |
Source: Public Records
Map
Nearby Homes
- 14004 Calle Rosales
- 401 Corte Mismo
- 13801 Las Entradas
- 14016 Las Entradas
- 14013 Las Entradas
- 1215 Brookline Ln
- 13904 Veracruz Dr
- 101 Cortez Ct
- 14308 San Jose Ave
- 13301 Paisley Ct
- 309 Sonoma Vine Ct
- 13801 San Esteban Ave
- 14600 Central Coast St
- 14506 Johnson Rd
- 14616 Tralee Dr
- 300 Solecita Way
- 13813 Toluca Dr
- 18 Claudia Autumn Dr
- 214 Irish Crystal Ct
- 705 Harrisburg St
- 13804 Via Contento
- 13812 Via Contento
- 13800 Via Contento
- 13816 Via Contento
- 13801 Via La Madera
- 13711 Via La Madera
- 323 Portola Ct
- 330 Via Rosario
- 13805 Via La Madera
- 13706 Via Contento
- 13902 Via Contento
- 13707 Via La Madera
- 315 Portola Ct
- 13809 Via La Madera
- 322 Via Rosario
- 13702 Via Contento
- 13906 Via Contento
- 322 Portola Ct
- 13903 Via Contento
- 313 Portola Ct
Your Personal Tour Guide
Ask me questions while you tour the home.