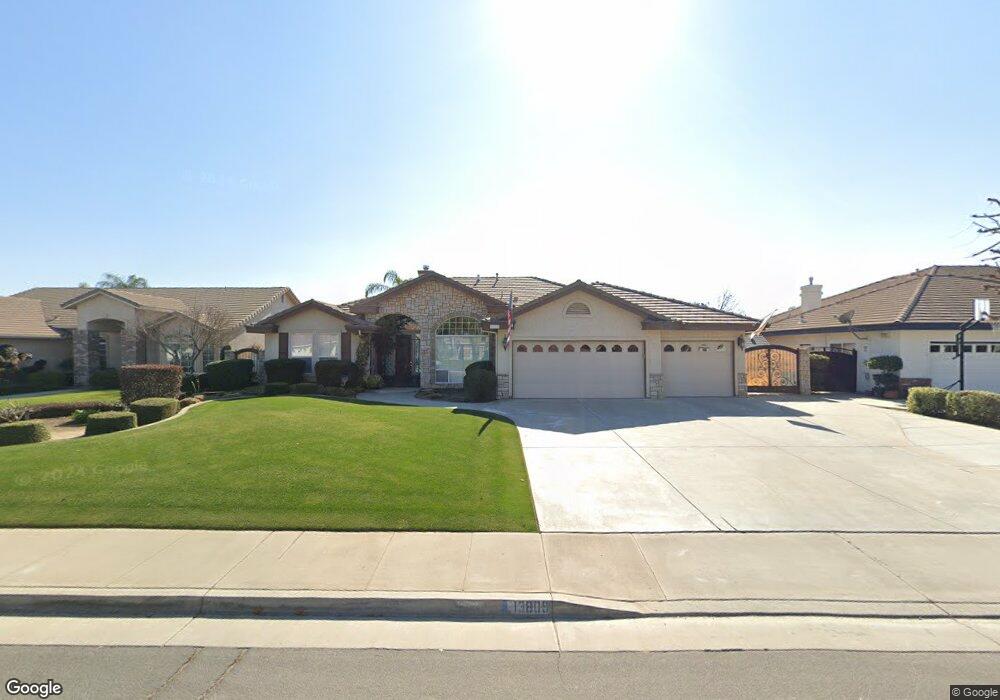
13809 Cedar Creek Ave Bakersfield, CA 93314
Estimated Value: $648,000 - $747,000
4
Beds
3
Baths
2,641
Sq Ft
$260/Sq Ft
Est. Value
About This Home
This home is located at 13809 Cedar Creek Ave, Bakersfield, CA 93314 and is currently estimated at $687,971, approximately $260 per square foot. 13809 Cedar Creek Ave is a home located in Kern County with nearby schools including Patriot Elementary School, Freedom Middle School, and Frontier High School.
Ownership History
Date
Name
Owned For
Owner Type
Purchase Details
Closed on
Mar 5, 2020
Sold by
Meyers David F and Meyers Vonda Y
Bought by
Meyers David F and Meyers Vonda Y
Current Estimated Value
Purchase Details
Closed on
Nov 2, 1999
Sold by
Hill Bryan and Hill Stephanie
Bought by
Meyers David F and Meyers Vonda Y
Home Financials for this Owner
Home Financials are based on the most recent Mortgage that was taken out on this home.
Original Mortgage
$217,550
Outstanding Balance
$66,873
Interest Rate
7.84%
Estimated Equity
$621,098
Purchase Details
Closed on
Dec 8, 1998
Sold by
Batey Development Inc
Bought by
Hill Bryan and Hill Stephanie
Home Financials for this Owner
Home Financials are based on the most recent Mortgage that was taken out on this home.
Original Mortgage
$181,125
Interest Rate
6.82%
Create a Home Valuation Report for This Property
The Home Valuation Report is an in-depth analysis detailing your home's value as well as a comparison with similar homes in the area
Home Values in the Area
Average Home Value in this Area
Purchase History
| Date | Buyer | Sale Price | Title Company |
|---|---|---|---|
| Meyers David F | -- | None Available | |
| Meyers David F | $229,000 | First American Title Co | |
| Hill Bryan | -- | First American Title Co |
Source: Public Records
Mortgage History
| Date | Status | Borrower | Loan Amount |
|---|---|---|---|
| Open | Meyers David F | $217,550 | |
| Previous Owner | Hill Bryan | $181,125 |
Source: Public Records
Tax History Compared to Growth
Tax History
| Year | Tax Paid | Tax Assessment Tax Assessment Total Assessment is a certain percentage of the fair market value that is determined by local assessors to be the total taxable value of land and additions on the property. | Land | Improvement |
|---|---|---|---|---|
| 2025 | $5,206 | $366,995 | $61,465 | $305,530 |
| 2024 | $5,206 | $359,800 | $60,260 | $299,540 |
| 2023 | $5,052 | $352,747 | $59,079 | $293,668 |
| 2022 | $4,939 | $345,832 | $57,921 | $287,911 |
| 2021 | $4,814 | $339,052 | $56,786 | $282,266 |
| 2020 | $4,738 | $335,577 | $56,204 | $279,373 |
| 2019 | $4,664 | $335,577 | $56,204 | $279,373 |
| 2018 | $4,545 | $322,550 | $54,022 | $268,528 |
| 2017 | $4,477 | $316,227 | $52,963 | $263,264 |
| 2016 | $4,169 | $310,028 | $51,925 | $258,103 |
| 2015 | $4,127 | $305,373 | $51,146 | $254,227 |
| 2014 | $4,037 | $299,393 | $50,145 | $249,248 |
Source: Public Records
Map
Nearby Homes
- 14012 Cedar Creek Ave
- 13946 Santa fe Ct
- 3849 Jenkins Rd
- 14014 Santa fe Ct
- 13602 Philip Phelps Ave
- 0 Rosedale Unit 202511650
- 3611 Jenkins Rd
- 3616 Three Bars St
- 13507 Velma Pearl Way
- 13615 Velma Pearl Way
- 14508 Plumeria Ct
- 14631 Blue Stream Ave
- 13303 Ascot Ct
- 3408 Shauna Marie St
- 13421 Cheyenne Mountain Dr
- 14507 Evadell Ct
- 13404 Cheyenne Mountain Dr
- 14301 Shady Tree Ct
- 14300 Shady Tree Ct
- 14822 Plumeria Ct
- 13803 Cedar Creek Ave
- 13817 Cedar Creek Ave
- 13715 Cedar Creek Ave
- 13800 Table Rock Ave Unit A
- 13806 Table Rock Ave Unit A
- 13823 Cedar Creek Ave
- 13812 Table Rock Ave
- 13808 Cedar Creek Ave Unit A
- 13802 Cedar Creek Ave Unit A
- 13814 Cedar Creek Ave Unit A
- 13707 Cedar Creek Ave
- 13712 Cedar Creek Ave
- 13818 Table Rock Ave
- 13829 Cedar Creek Ave Unit B
- 13708 Table Rock Ave
- 13820 Cedar Creek Ave
- 13706 Cedar Creek Ave
- 13701 Cedar Creek Ave
- 13824 Table Rock Ave
- 13813 Searspoint Ave