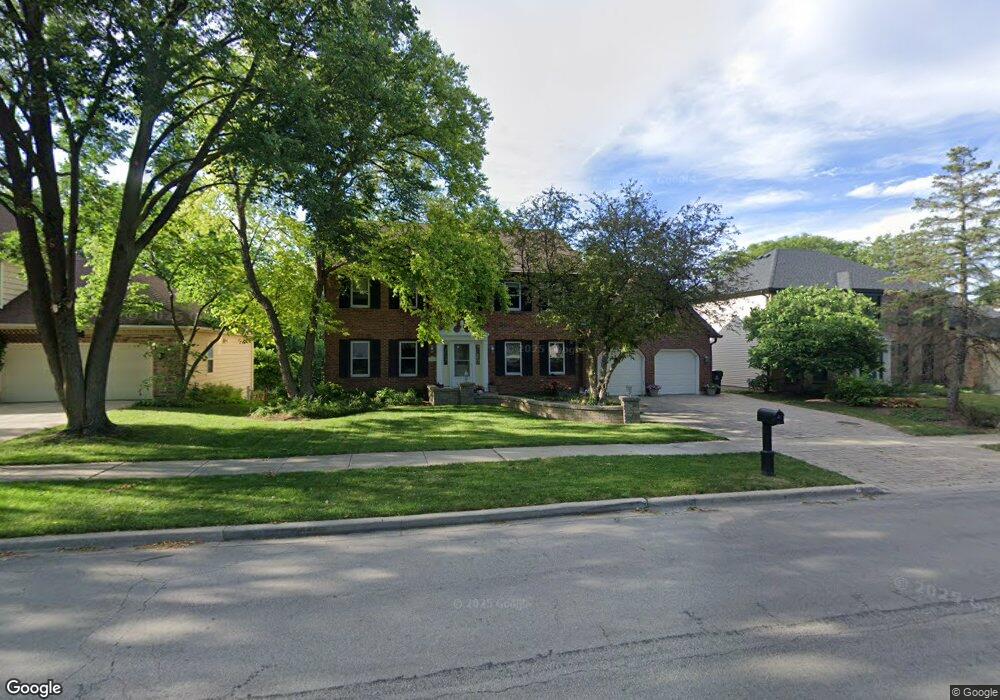
1381 E Gartner Rd Naperville, IL 60540
Huntington Hill NeighborhoodEstimated Value: $764,027 - $900,000
Studio
1
Bath
3,056
Sq Ft
$275/Sq Ft
Est. Value
About This Home
This home is located at 1381 E Gartner Rd, Naperville, IL 60540 and is currently estimated at $840,257, approximately $274 per square foot. 1381 E Gartner Rd is a home located in DuPage County with nearby schools including Prairie Elementary School, Washington Jr High School, and Naperville North High School.
Ownership History
Date
Name
Owned For
Owner Type
Purchase Details
Closed on
Jul 14, 2000
Sold by
Sudak Mark and Sudak Mary
Bought by
Kaura Ratish and Kaura Rita
Current Estimated Value
Purchase Details
Closed on
Nov 14, 1998
Sold by
Cullen Michael J and Cullen J M
Bought by
Sudak Mark R and Sudak Mary L
Purchase Details
Closed on
Dec 15, 1997
Sold by
Schacht Jack E and Schacht Mitzie
Bought by
Cullen Michael J and Cullen Marcia A
Create a Home Valuation Report for This Property
The Home Valuation Report is an in-depth analysis detailing your home's value as well as a comparison with similar homes in the area
Home Values in the Area
Average Home Value in this Area
Purchase History
| Date | Buyer | Sale Price | Title Company |
|---|---|---|---|
| Kaura Ratish | $392,000 | -- | |
| Sudak Mark R | $358,000 | -- | |
| Cullen Michael J | $330,500 | First American Title |
Source: Public Records
Tax History
| Year | Tax Paid | Tax Assessment Tax Assessment Total Assessment is a certain percentage of the fair market value that is determined by local assessors to be the total taxable value of land and additions on the property. | Land | Improvement |
|---|---|---|---|---|
| 2024 | $12,426 | $218,833 | $80,468 | $138,365 |
| 2023 | $11,938 | $199,720 | $73,440 | $126,280 |
| 2022 | $12,214 | $199,720 | $73,440 | $126,280 |
| 2021 | $11,759 | $192,160 | $70,660 | $121,500 |
| 2020 | $11,505 | $188,710 | $69,390 | $119,320 |
| 2019 | $11,489 | $180,550 | $66,390 | $114,160 |
| 2018 | $11,259 | $177,010 | $65,090 | $111,920 |
| 2017 | $11,037 | $171,040 | $62,890 | $108,150 |
| 2016 | $10,820 | $164,860 | $60,620 | $104,240 |
| 2015 | $11,451 | $164,850 | $60,620 | $104,230 |
| 2014 | $11,824 | $164,850 | $60,620 | $104,230 |
| 2013 | $11,646 | $165,250 | $60,770 | $104,480 |
Source: Public Records
Map
Nearby Homes
- 311 Millcreek Ln
- 1010 Revere Ct
- 1172 Kenilworth Cir
- 907 Secretariat Dr
- 1204 Hobson Oaks Ct Unit 1204
- 221 Olesen Dr
- 923 Tim Tam Cir
- 2450 Tanglewood Dr
- 6333 Kent Ct
- 2412 Pepper Tree Ct
- 1285 Stonebriar Ct
- 908 Julian Ct
- 2764 Weeping Willow Dr Unit A
- 820 Prairie Ave
- 6S422 Naper Blvd
- 7S460 Donwood Dr W
- 8S452 Bell Dr
- 740 Prairie Ave
- 712 E Hillside Rd
- 616 Driftwood Ct
- 1385 E Gartner Rd
- 1377 E Gartner Rd
- 1389 E Gartner Rd
- 1373 E Gartner Rd Unit 4
- 801 Glenmore Ct Unit 4
- 1393 E Gartner Rd Unit 4
- 1369 E Gartner Rd
- 1390 E Gartner Rd
- 1372 E Gartner Rd
- 805 Glenmore Ct
- 1394 E Gartner Rd
- 1397 E Gartner Rd
- 1365 E Gartner Rd
- 609 Leesburg Ct
- 804 Rockbridge Dr
- 1398 E Gartner Rd
- 809 Glenmore Ct
- 816 Glenmore Ct
- 1401 E Gartner Rd
- 612 Leesburg Ct
Your Personal Tour Guide
Ask me questions while you tour the home.