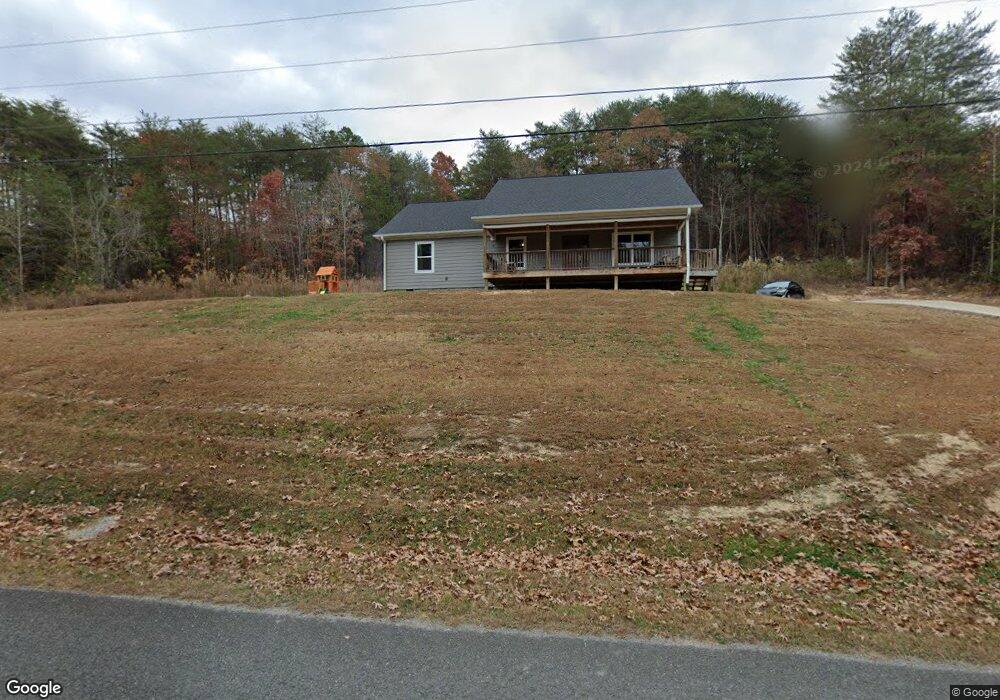
1381 John Burch Rd Dunlap, TN 37327
Estimated Value: $370,362 - $505,000
--
Bed
--
Bath
1,785
Sq Ft
$238/Sq Ft
Est. Value
About This Home
This home is located at 1381 John Burch Rd, Dunlap, TN 37327 and is currently estimated at $424,341, approximately $237 per square foot. 1381 John Burch Rd is a home with nearby schools including Griffith Elementary School, Sequatchie County Middle School, and Sequatchie County High School.
Ownership History
Date
Name
Owned For
Owner Type
Purchase Details
Closed on
Sep 30, 2019
Sold by
Childs David
Bought by
Mabey Christopher Robert
Current Estimated Value
Home Financials for this Owner
Home Financials are based on the most recent Mortgage that was taken out on this home.
Original Mortgage
$198,819
Outstanding Balance
$173,018
Interest Rate
3.5%
Mortgage Type
FHA
Estimated Equity
$251,323
Purchase Details
Closed on
Jan 25, 2019
Sold by
Hendon Jim L and Hendon Julia E
Bought by
Childs David
Purchase Details
Closed on
Apr 6, 2017
Sold by
Hanschen Stephen M
Bought by
Hendon Jim L and Hendon Julia E
Purchase Details
Closed on
Jan 30, 2007
Sold by
Terry Bartoli
Bought by
Hanschen Stephen M
Purchase Details
Closed on
Jun 24, 2000
Bought by
Bartoli Terry and Wife Amalia
Create a Home Valuation Report for This Property
The Home Valuation Report is an in-depth analysis detailing your home's value as well as a comparison with similar homes in the area
Home Values in the Area
Average Home Value in this Area
Purchase History
| Date | Buyer | Sale Price | Title Company |
|---|---|---|---|
| Mabey Christopher Robert | $204,000 | Fidelity National Ttl Ins Co | |
| Childs David | $13,000 | None Available | |
| Hendon Jim L | $8,500 | -- | |
| Hanschen Stephen M | $25,000 | -- | |
| Bartoli Terry | $17,500 | -- |
Source: Public Records
Mortgage History
| Date | Status | Borrower | Loan Amount |
|---|---|---|---|
| Open | Mabey Christopher Robert | $198,819 |
Source: Public Records
Tax History Compared to Growth
Tax History
| Year | Tax Paid | Tax Assessment Tax Assessment Total Assessment is a certain percentage of the fair market value that is determined by local assessors to be the total taxable value of land and additions on the property. | Land | Improvement |
|---|---|---|---|---|
| 2025 | $2,215 | $91,750 | $0 | $0 |
| 2024 | $2,215 | $91,750 | $5,750 | $86,000 |
| 2023 | $2,215 | $91,750 | $5,750 | $86,000 |
| 2022 | $1,749 | $52,700 | $5,500 | $47,200 |
| 2021 | $1,722 | $52,700 | $5,500 | $47,200 |
| 2020 | $1,722 | $52,700 | $5,500 | $47,200 |
| 2019 | $179 | $5,500 | $5,500 | $0 |
| 2018 | $177 | $5,500 | $5,500 | $0 |
| 2017 | $175 | $5,500 | $5,500 | $0 |
| 2016 | $183 | $5,500 | $5,500 | $0 |
| 2015 | $183 | $5,500 | $5,500 | $0 |
| 2014 | $183 | $5,500 | $5,500 | $0 |
Source: Public Records
Map
Nearby Homes
- 3 Countryside Dr
- 27 Skyhigh Dr
- 0 Skyhigh Dr Unit 1518263
- 0 Skyhigh Dr Unit RTC2867014
- 300 Skyhigh Dr
- 0 Skyhigh Dr Unit RTC2970790
- 0 Skyhigh Dr Unit 1505984
- O Skyhigh Dr
- 00 Countryside Dr
- 0 Countryside Dr Unit RTC3035699
- 1 Countryside Dr
- 0 Countryside Dr Unit 1310228
- 16 Countryside Dr
- 919 John Burch Rd
- 152 Highland Dr
- 235 Highland Dr
- 347 Highland Dr
- 0 Treeline Dr Unit 1510685
- 0 Treeline Dr Unit RTC2815537
- 0 Treeline Dr Unit 1510684
- 1404 John Burch Rd
- 50 Bearchase Rd
- 2778 Hudlow Loop Rd
- 56 Bearchase Rd
- 32 John Burch Rd E
- 10 Jodie Land
- 1456 John Burch Rd
- 242 Spring St N
- 242 Spring St N Unit N
- 32 W John Burch Rd
- 15 Countryside Dr
- 11 Countryside Dr
- - Skyhigh Dr
- - Skyhigh Dr Unit 23 & 24
- 98 Spring Creek Dr
- Lot 3 John Birch Rd Unit 3
- Lot 2 John Birch Rd Unit 2
- 317 Sky High Dr
- 1312 John Burch Rd
- 21&22 Skyhigh Dr