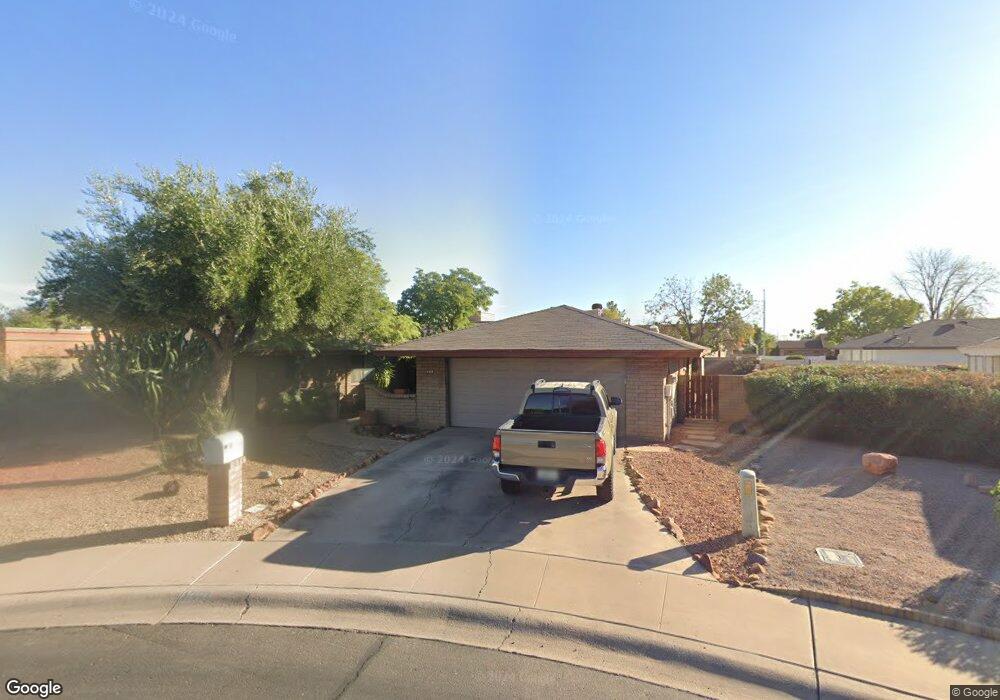
1381 N Orval Cir Chandler, AZ 85225
North Chandler NeighborhoodEstimated Value: $443,463 - $567,000
--
Bed
3
Baths
2,297
Sq Ft
$229/Sq Ft
Est. Value
About This Home
This home is located at 1381 N Orval Cir, Chandler, AZ 85225 and is currently estimated at $527,116, approximately $229 per square foot. 1381 N Orval Cir is a home located in Maricopa County with nearby schools including Sanborn Elementary School, Chandler High School, and Andersen Junior High School.
Ownership History
Date
Name
Owned For
Owner Type
Purchase Details
Closed on
Sep 28, 2005
Sold by
Christiansen Shauna K and Estate Of Wanda Jewell
Bought by
Christiansen John Earl and Christiansen Shauna Kay
Current Estimated Value
Purchase Details
Closed on
Oct 6, 2000
Sold by
Kelley Robert D and Kelley Laura A
Bought by
Christiansen John Earl and Christiansen Shauna Kay
Home Financials for this Owner
Home Financials are based on the most recent Mortgage that was taken out on this home.
Original Mortgage
$150,950
Outstanding Balance
$54,656
Interest Rate
7.82%
Mortgage Type
New Conventional
Estimated Equity
$472,460
Purchase Details
Closed on
Oct 18, 1996
Sold by
Stanford Donald G and Stanford Maryanne M
Bought by
Kelley Robert D and Kelley Laura A
Home Financials for this Owner
Home Financials are based on the most recent Mortgage that was taken out on this home.
Original Mortgage
$131,100
Interest Rate
8.3%
Mortgage Type
New Conventional
Create a Home Valuation Report for This Property
The Home Valuation Report is an in-depth analysis detailing your home's value as well as a comparison with similar homes in the area
Home Values in the Area
Average Home Value in this Area
Purchase History
| Date | Buyer | Sale Price | Title Company |
|---|---|---|---|
| Christiansen John Earl | -- | Transnation Title Ins Co | |
| Christiansen John Earl | $158,900 | First American Title | |
| Kelley Robert D | $138,000 | First American Title |
Source: Public Records
Mortgage History
| Date | Status | Borrower | Loan Amount |
|---|---|---|---|
| Open | Christiansen John Earl | $150,950 | |
| Previous Owner | Kelley Robert D | $131,100 |
Source: Public Records
Tax History Compared to Growth
Tax History
| Year | Tax Paid | Tax Assessment Tax Assessment Total Assessment is a certain percentage of the fair market value that is determined by local assessors to be the total taxable value of land and additions on the property. | Land | Improvement |
|---|---|---|---|---|
| 2025 | $1,760 | $22,596 | -- | -- |
| 2024 | $1,700 | $21,520 | -- | -- |
| 2023 | $1,700 | $40,610 | $8,120 | $32,490 |
| 2022 | $1,640 | $29,870 | $5,970 | $23,900 |
| 2021 | $1,719 | $27,820 | $5,560 | $22,260 |
| 2020 | $1,712 | $26,150 | $5,230 | $20,920 |
| 2019 | $1,646 | $24,400 | $4,880 | $19,520 |
| 2018 | $1,594 | $22,520 | $4,500 | $18,020 |
| 2017 | $1,486 | $21,180 | $4,230 | $16,950 |
| 2016 | $1,431 | $21,110 | $4,220 | $16,890 |
| 2015 | $1,387 | $18,870 | $3,770 | $15,100 |
Source: Public Records
Map
Nearby Homes
- 440 W Ironwood Dr
- 1419 N Vine St
- 403 W Gail Dr
- 1100 N California St
- 1580 N Sunset Place
- 728 W Calle Del Norte
- 1955 N Illinois St
- 1961 N Hartford St Unit 1178
- 1961 N Hartford St Unit 1092
- 1505 N Evergreen St Unit 17
- 1255 N Arizona Ave Unit 1289
- 1255 N Arizona Ave Unit 1197
- 1255 N Arizona Ave Unit 1248
- 1255 N Arizona Ave Unit 1251
- 1255 N Arizona Ave Unit 1323
- 1255 N Arizona Ave Unit 1062
- 1255 N Arizona Ave Unit 1258
- 1255 N Arizona Ave Unit 1124
- 555 W Warner Rd Unit 127
- 555 W Warner Rd Unit 139
- 1367 N Orval Cir
- 419 W Knox Rd
- 417 W Knox Rd
- 421 W Knox Rd
- 415 W Knox Rd
- 1380 N Nebraska St Unit 7
- 1382 N Orval Cir
- 1364 N Nebraska St
- 413 W Knox Rd
- 423 W Knox Rd
- 1366 N Orval Cir
- 428 W Kent Dr
- 425 W Knox Rd
- 411 W Knox Rd
- 427 W Knox Rd
- 400 W Kent Dr
- 409 W Knox Rd
- 474 W Kent Dr
- 429 W Knox Rd
- 407 W Knox Rd