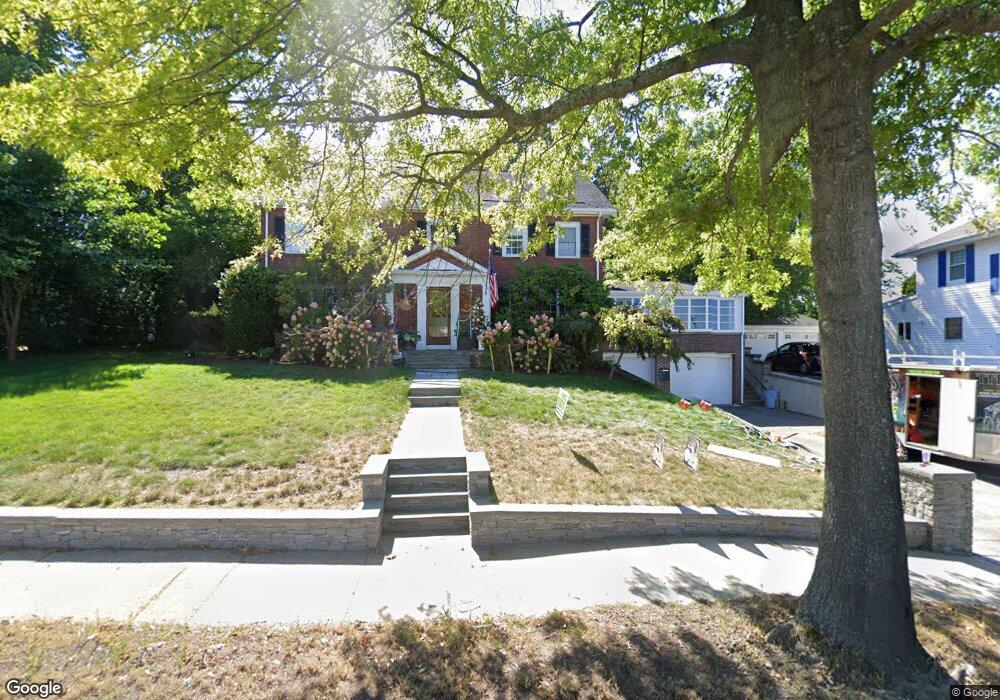
1381 Quincy Shore Dr Quincy, MA 02169
Merrymount NeighborhoodEstimated Value: $1,060,000 - $1,230,000
4
Beds
4
Baths
2,940
Sq Ft
$383/Sq Ft
Est. Value
About This Home
This home is located at 1381 Quincy Shore Dr, Quincy, MA 02169 and is currently estimated at $1,127,287, approximately $383 per square foot. 1381 Quincy Shore Dr is a home located in Norfolk County with nearby schools including Merrymount Elementary School, Central Middle School, and Quincy High School.
Ownership History
Date
Name
Owned For
Owner Type
Purchase Details
Closed on
Oct 12, 2007
Sold by
Corbett Mary
Bought by
Chan Min L and Chan Ka W
Current Estimated Value
Home Financials for this Owner
Home Financials are based on the most recent Mortgage that was taken out on this home.
Original Mortgage
$398,000
Interest Rate
6.49%
Mortgage Type
Purchase Money Mortgage
Purchase Details
Closed on
Nov 6, 1987
Sold by
Dagostino Chas J
Bought by
Corbett Matthew J
Create a Home Valuation Report for This Property
The Home Valuation Report is an in-depth analysis detailing your home's value as well as a comparison with similar homes in the area
Home Values in the Area
Average Home Value in this Area
Purchase History
| Date | Buyer | Sale Price | Title Company |
|---|---|---|---|
| Chan Min L | $598,000 | -- | |
| Corbett Matthew J | $335,000 | -- |
Source: Public Records
Mortgage History
| Date | Status | Borrower | Loan Amount |
|---|---|---|---|
| Open | Corbett Matthew J | $255,000 | |
| Closed | Corbett Matthew J | $100,000 | |
| Open | Corbett Matthew J | $390,000 | |
| Closed | Chan Min L | $398,000 | |
| Previous Owner | Corbett Matthew J | $180,000 |
Source: Public Records
Tax History Compared to Growth
Tax History
| Year | Tax Paid | Tax Assessment Tax Assessment Total Assessment is a certain percentage of the fair market value that is determined by local assessors to be the total taxable value of land and additions on the property. | Land | Improvement |
|---|---|---|---|---|
| 2025 | $11,166 | $968,400 | $333,700 | $634,700 |
| 2024 | $10,663 | $946,100 | $324,200 | $621,900 |
| 2023 | $9,581 | $860,800 | $282,500 | $578,300 |
| 2022 | $10,181 | $849,800 | $257,400 | $592,400 |
| 2021 | $10,056 | $828,300 | $257,400 | $570,900 |
| 2020 | $9,390 | $755,400 | $198,100 | $557,300 |
| 2019 | $8,964 | $714,300 | $185,400 | $528,900 |
| 2018 | $8,838 | $662,500 | $172,000 | $490,500 |
| 2017 | $8,610 | $607,600 | $172,000 | $435,600 |
| 2016 | $8,375 | $583,200 | $180,000 | $403,200 |
| 2015 | $7,961 | $545,300 | $175,900 | $369,400 |
| 2014 | $7,530 | $506,700 | $164,100 | $342,600 |
Source: Public Records
Map
Nearby Homes
- 1421 Quincy Shore Dr
- 1427 Quincy Shore Dr
- 188 Samoset Ave
- 105 Sea St Unit 301
- 105 Sea St Unit 203
- 105 Sea St Unit 105
- 37 Hobomack Rd
- 74 Butler Rd
- 20 Putnam St
- 100 Thornton St
- 20 Whitney Rd Unit 1
- 1025 Hancock St Unit 2K
- 1 Adams St Unit 707
- 66 Mcgrath Hwy Unit 407
- 66 Mcgrath Hwy Unit 405
- 66 Mcgrath Hwy Unit 308
- 66 Mcgrath Hwy Unit 303
- 66 Mcgrath Hwy Unit 508
- 59 Spear St Unit 302
- 59 Spear St Unit 301
- 1373 Quincy Shore Dr
- 1385 Quincy Shore Dr
- 1367 Quincy Shore Dr
- 1391 Quincy Shore Dr
- 26 Ridgeway Dr
- 1380 Quincy Shore Dr
- 1384 Quincy Shore Dr
- 1374 Quincy Shore Dr
- 30 Ridgeway Dr
- 105 Samoset Ave
- 1395 Quincy Shore Dr
- 101 Samoset Ave
- 1390 Quincy Shore Dr
- 133 Samoset Ave
- 1399 Quincy Shore Dr
- 137 Samoset Ave
- 1396 Quincy Shore Dr
- 1361 Quincy Shore Dr
- 38 Ridgeway Dr
- 1356 Quincy Shore Dr