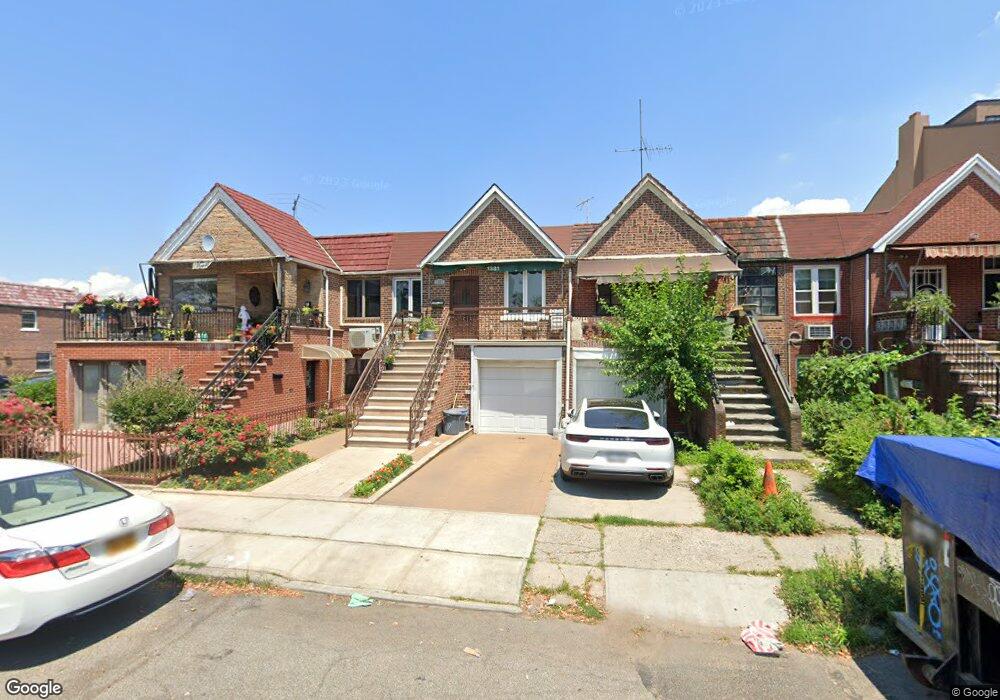
1381 Shore Pkwy Brooklyn, NY 11214
Bath Beach NeighborhoodEstimated Value: $1,163,000 - $1,275,801
--
Bed
--
Bath
1,993
Sq Ft
$604/Sq Ft
Est. Value
About This Home
This home is located at 1381 Shore Pkwy, Brooklyn, NY 11214 and is currently estimated at $1,203,950, approximately $604 per square foot. 1381 Shore Pkwy is a home located in Kings County with nearby schools including Is 281 Joseph B Cavallaro, Sinai Academic Center, and Elite Academy of Science & Technology (EAST).
Ownership History
Date
Name
Owned For
Owner Type
Purchase Details
Closed on
Dec 6, 2024
Sold by
Zhong Hui Huan
Bought by
Hui Huan Zhong Irrevocable Trust and Philip Lu As Trustee
Current Estimated Value
Purchase Details
Closed on
Nov 15, 2013
Sold by
Pozzuoli Angela and Pozzuoli Pino
Bought by
Zhong Hui Huan
Home Financials for this Owner
Home Financials are based on the most recent Mortgage that was taken out on this home.
Original Mortgage
$359,000
Interest Rate
4.29%
Mortgage Type
New Conventional
Purchase Details
Closed on
May 9, 2001
Sold by
Brown Charlotte and Fields Harriet
Bought by
Pozzouli Pino and Pozzouli Angela
Home Financials for this Owner
Home Financials are based on the most recent Mortgage that was taken out on this home.
Original Mortgage
$225,000
Interest Rate
7.09%
Mortgage Type
Purchase Money Mortgage
Purchase Details
Closed on
Jan 26, 1994
Sold by
Marcus Irving
Bought by
Brown Charlotte and Fields Harriet
Create a Home Valuation Report for This Property
The Home Valuation Report is an in-depth analysis detailing your home's value as well as a comparison with similar homes in the area
Home Values in the Area
Average Home Value in this Area
Purchase History
| Date | Buyer | Sale Price | Title Company |
|---|---|---|---|
| Hui Huan Zhong Irrevocable Trust | -- | -- | |
| Zhong Hui Huan | $599,000 | -- | |
| Zhong Hui Huan | $599,000 | -- | |
| Pozzouli Pino | -- | -- | |
| Pozzouli Pino | -- | -- | |
| Brown Charlotte | -- | -- | |
| Brown Charlotte | -- | -- |
Source: Public Records
Mortgage History
| Date | Status | Borrower | Loan Amount |
|---|---|---|---|
| Previous Owner | Zhong Hui Huan | $359,000 | |
| Previous Owner | Pozzouli Pino | $225,000 |
Source: Public Records
Tax History Compared to Growth
Tax History
| Year | Tax Paid | Tax Assessment Tax Assessment Total Assessment is a certain percentage of the fair market value that is determined by local assessors to be the total taxable value of land and additions on the property. | Land | Improvement |
|---|---|---|---|---|
| 2025 | $8,999 | $68,760 | $11,700 | $57,060 |
| 2024 | $8,999 | $58,380 | $11,700 | $46,680 |
| 2023 | $8,569 | $64,740 | $11,700 | $53,040 |
| 2022 | $8,415 | $58,620 | $11,700 | $46,920 |
| 2021 | $8,490 | $53,160 | $11,700 | $41,460 |
| 2020 | $3,972 | $62,880 | $11,700 | $51,180 |
| 2019 | $7,762 | $62,880 | $11,700 | $51,180 |
| 2018 | $7,108 | $36,327 | $7,633 | $28,694 |
| 2017 | $7,106 | $36,327 | $9,117 | $27,210 |
| 2016 | $6,645 | $34,789 | $10,453 | $24,336 |
| 2015 | $4,133 | $32,820 | $13,020 | $19,800 |
| 2014 | $4,133 | $32,089 | $12,730 | $19,359 |
Source: Public Records
Map
Nearby Homes
- 1383 Shore Pkwy
- 306 Bay 20th St
- 1333 Shore Pkwy Unit A
- 263 Bay 22nd St
- 289 Bay 19th St Unit B
- 271 Bay 19th St Unit B
- 263 Bay 19th St Unit B
- 248 Bay 19th St Unit B
- 1941 Cropsey Ave
- 304 Bay 17th St Unit 3A
- 8889 Bay 16th St Unit 1C
- 8867 Bay 16th St Unit B3
- 1830 Bath Ave Unit A102
- 8880 Bay 16th St
- 143 Bay 20th St Unit 5
- 8759 18th Ave Unit 4
- 8820 Bay 16th St
- 187 Bay 26th St
- 8884 17th Ave
- 303 Bay 14th St