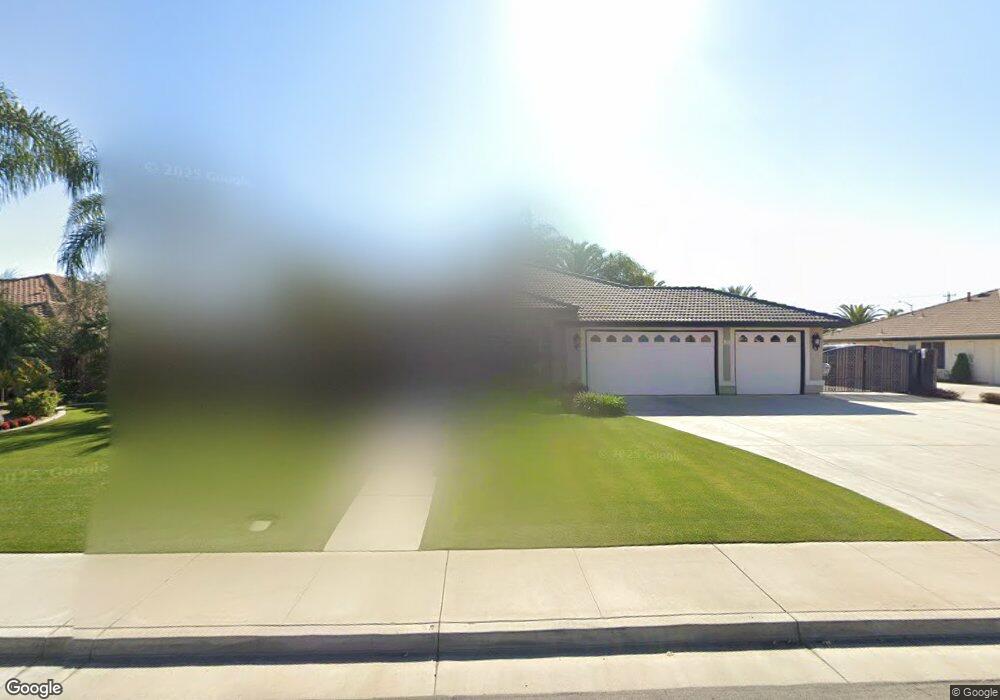
13815 Table Rock Ave Bakersfield, CA 93314
Estimated Value: $680,000 - $769,000
4
Beds
3
Baths
2,545
Sq Ft
$279/Sq Ft
Est. Value
About This Home
This home is located at 13815 Table Rock Ave, Bakersfield, CA 93314 and is currently estimated at $710,532, approximately $279 per square foot. 13815 Table Rock Ave is a home located in Kern County with nearby schools including Patriot Elementary School, Freedom Middle School, and Frontier High School.
Ownership History
Date
Name
Owned For
Owner Type
Purchase Details
Closed on
Jun 22, 2005
Sold by
Utt Dennis G and Utt Maria Dianne
Bought by
Utt Dennis G and Utt Maria D
Current Estimated Value
Purchase Details
Closed on
Feb 28, 2002
Sold by
Chase David and Chase Melissa
Bought by
Utt Dennis G and Utt Maria Dianne
Home Financials for this Owner
Home Financials are based on the most recent Mortgage that was taken out on this home.
Original Mortgage
$285,000
Interest Rate
6.99%
Purchase Details
Closed on
Mar 6, 1998
Sold by
Batey Development Inc
Bought by
Chase David and Chase Melissa
Home Financials for this Owner
Home Financials are based on the most recent Mortgage that was taken out on this home.
Original Mortgage
$227,000
Interest Rate
7.06%
Mortgage Type
Construction
Create a Home Valuation Report for This Property
The Home Valuation Report is an in-depth analysis detailing your home's value as well as a comparison with similar homes in the area
Home Values in the Area
Average Home Value in this Area
Purchase History
| Date | Buyer | Sale Price | Title Company |
|---|---|---|---|
| Utt Dennis G | -- | -- | |
| Utt Dennis G | $300,000 | First American Title Co | |
| Chase David | -- | First American Title Co |
Source: Public Records
Mortgage History
| Date | Status | Borrower | Loan Amount |
|---|---|---|---|
| Previous Owner | Utt Dennis G | $285,000 | |
| Previous Owner | Chase David | $227,000 |
Source: Public Records
Tax History
| Year | Tax Paid | Tax Assessment Tax Assessment Total Assessment is a certain percentage of the fair market value that is determined by local assessors to be the total taxable value of land and additions on the property. | Land | Improvement |
|---|---|---|---|---|
| 2025 | $5,881 | $478,007 | $73,854 | $404,153 |
| 2024 | $5,698 | $468,635 | $72,406 | $396,229 |
| 2023 | $5,698 | $459,448 | $70,987 | $388,461 |
| 2022 | $5,583 | $450,441 | $69,596 | $380,845 |
| 2021 | $5,456 | $441,611 | $68,232 | $373,379 |
| 2020 | $5,382 | $437,084 | $67,533 | $369,551 |
| 2019 | $5,300 | $437,084 | $67,533 | $369,551 |
| 2018 | $5,164 | $420,114 | $64,911 | $355,203 |
| 2017 | $5,091 | $411,878 | $63,639 | $348,239 |
| 2016 | $4,716 | $403,804 | $62,392 | $341,412 |
| 2015 | $4,672 | $397,739 | $61,455 | $336,284 |
| 2014 | $4,486 | $382,000 | $96,000 | $286,000 |
Source: Public Records
Map
Nearby Homes
- 14025 Desert Rose Ct
- 14012 Cedar Creek Ave
- 3849 Jenkins Rd
- 14332 Table Rock Ave
- 13620 Philip Phelps Ave
- 13547 Philip Phelps Ave
- 13602 Philip Phelps Ave
- 13601 Philip Phelps Ave
- 13615 Velma Pearl Way
- 13507 Velma Pearl Way
- 13544 Velma Pearl Way
- 0 Rosedale Unit 202511650
- 14705 Citrus Tree Ct
- 14524 Plumeria Ct
- 14631 Blue Stream Ave
- 13303 Ascot Ct
- 3408 Shauna Marie St
- 55 Allen Rd
- 4140 Meadow Lake Dr
- 14507 Evadell Ct
- 13821 Table Rock Ave
- 13807 Table Rock Ave Unit A
- 13903 Table Rock Ave Unit B
- 13801 Table Rock Ave Unit A
- 13818 Table Rock Ave
- 13812 Table Rock Ave
- 13824 Table Rock Ave
- 13806 Table Rock Ave Unit A
- 13900 Table Rock Ave
- 13910 Desert Rose Ct
- 13909 Table Rock Ave
- 13715 Table Rock Ave
- 13800 Table Rock Ave Unit A
- 13926 Desert Rose Ct
- 13906 Table Rock Ave
- 13823 Cedar Creek Ave
- 13942 Desert Rose Ct
- 13829 Cedar Creek Ave Unit B
- 13817 Cedar Creek Ave
- 13915 Table Rock Ave
Your Personal Tour Guide
Ask me questions while you tour the home.