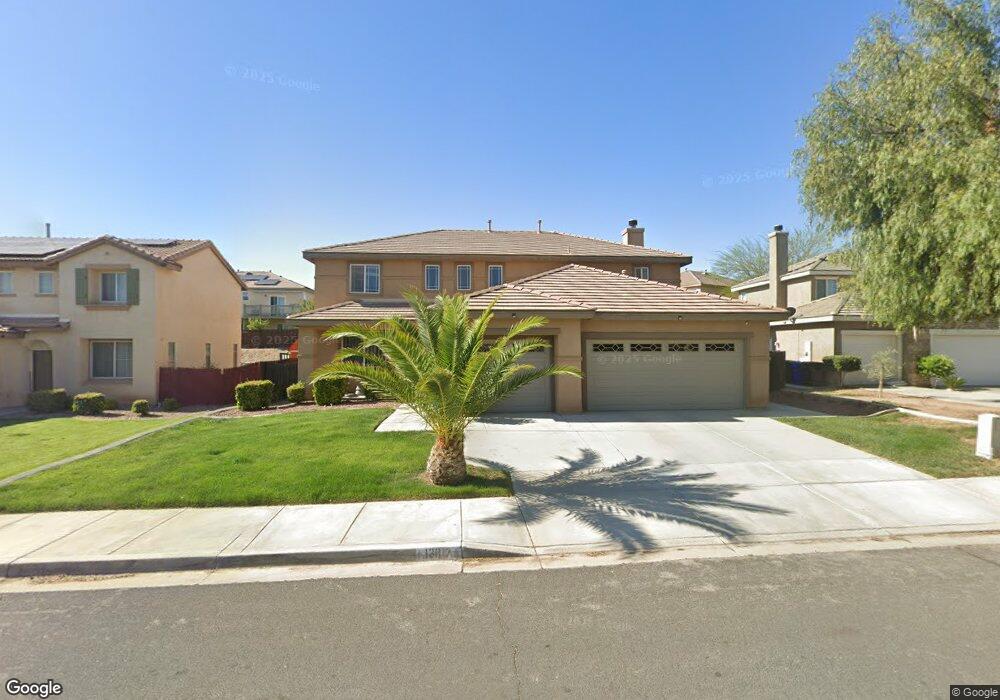
13817 Goldfinch Ct Victorville, CA 92394
Estimated Value: $475,097 - $546,000
5
Beds
3
Baths
3,038
Sq Ft
$167/Sq Ft
Est. Value
About This Home
This home is located at 13817 Goldfinch Ct, Victorville, CA 92394 and is currently estimated at $506,274, approximately $166 per square foot. 13817 Goldfinch Ct is a home located in San Bernardino County with nearby schools including Brentwood Elementary School, Village Elementary School, and Challenger School Of Sports And Fitness.
Ownership History
Date
Name
Owned For
Owner Type
Purchase Details
Closed on
Mar 24, 2009
Sold by
Citimortgage Inc
Bought by
Jackson Charlene
Current Estimated Value
Home Financials for this Owner
Home Financials are based on the most recent Mortgage that was taken out on this home.
Original Mortgage
$152,192
Interest Rate
4.8%
Mortgage Type
FHA
Purchase Details
Closed on
Aug 21, 2008
Sold by
Do Trang
Bought by
Citimortgage Inc
Purchase Details
Closed on
Jul 25, 2005
Sold by
Victorville Residential Development Part
Bought by
Do Trang
Home Financials for this Owner
Home Financials are based on the most recent Mortgage that was taken out on this home.
Original Mortgage
$312,737
Interest Rate
6.62%
Mortgage Type
New Conventional
Create a Home Valuation Report for This Property
The Home Valuation Report is an in-depth analysis detailing your home's value as well as a comparison with similar homes in the area
Home Values in the Area
Average Home Value in this Area
Purchase History
| Date | Buyer | Sale Price | Title Company |
|---|---|---|---|
| Jackson Charlene | $155,000 | First American Title Company | |
| Citimortgage Inc | $269,100 | First American | |
| Do Trang | $391,000 | Fidelity-Riverside |
Source: Public Records
Mortgage History
| Date | Status | Borrower | Loan Amount |
|---|---|---|---|
| Previous Owner | Jackson Charlene | $152,192 | |
| Previous Owner | Do Trang | $312,737 |
Source: Public Records
Tax History Compared to Growth
Tax History
| Year | Tax Paid | Tax Assessment Tax Assessment Total Assessment is a certain percentage of the fair market value that is determined by local assessors to be the total taxable value of land and additions on the property. | Land | Improvement |
|---|---|---|---|---|
| 2025 | $3,605 | $202,731 | $25,756 | $176,975 |
| 2024 | $3,605 | $198,756 | $25,251 | $173,505 |
| 2023 | $3,557 | $194,859 | $24,756 | $170,103 |
| 2022 | $3,493 | $191,039 | $24,271 | $166,768 |
| 2021 | $3,428 | $187,293 | $23,795 | $163,498 |
| 2020 | $3,365 | $185,373 | $23,551 | $161,822 |
| 2019 | $3,305 | $181,738 | $23,089 | $158,649 |
| 2018 | $3,421 | $178,174 | $22,636 | $155,538 |
| 2017 | $3,351 | $174,680 | $22,192 | $152,488 |
| 2016 | $3,285 | $171,255 | $21,757 | $149,498 |
| 2015 | $3,186 | $168,682 | $21,430 | $147,252 |
| 2014 | $3,279 | $159,677 | $21,010 | $138,667 |
Source: Public Records
Map
Nearby Homes
- 13720 Dove Ct
- 14766 Shetland Ct
- 13971 Clydesdale Run Ln
- 14031 Horseshoe Way
- 14780 Butterfly Ct
- 14577 Crossing Trail
- 0 Brucite Rd Unit HD24249241
- 13509 Seneca Rd
- 14117 Gopher Canyon Rd
- 13651 Gold Stone Place
- 13551 Western Meadows Ln
- 14582 Hidden Canyon Ln
- 14115 Buckskin Ct
- 15121 Sorrel Rd
- 14964 Butler Peak Ct
- 14993 Brown Ln
- 15203 Zircon Dr
- 13476 Palmdale Rd
- 14304 Gray Fox Ln
- 15255 Sunray Ct
- 13827 Goldfinch Ct
- 13809 Goldfinch Ct
- 13826 Hawk Ct
- 13816 Hawk Ct Unit 4
- 13816 Hawk Ct
- 13836 Hawk Ct
- 13839 Goldfinch Ct
- 13802 Goldfinch Ct
- 13802 Goldfinch (Reduced ) Ct
- 13828 Goldfinch Ct
- 13818 Goldfinch Ct
- 13846 Hawk Ct
- 13840 Goldfinch Ct
- 13806 Hawk Ct
- 13849 Goldfinch Ct
- 13810 Goldfinch Ct
- 14627 Grouse Rd
- 14617 Grouse Rd
- 13856 Hawk Ct
- 13852 Goldfinch Ct