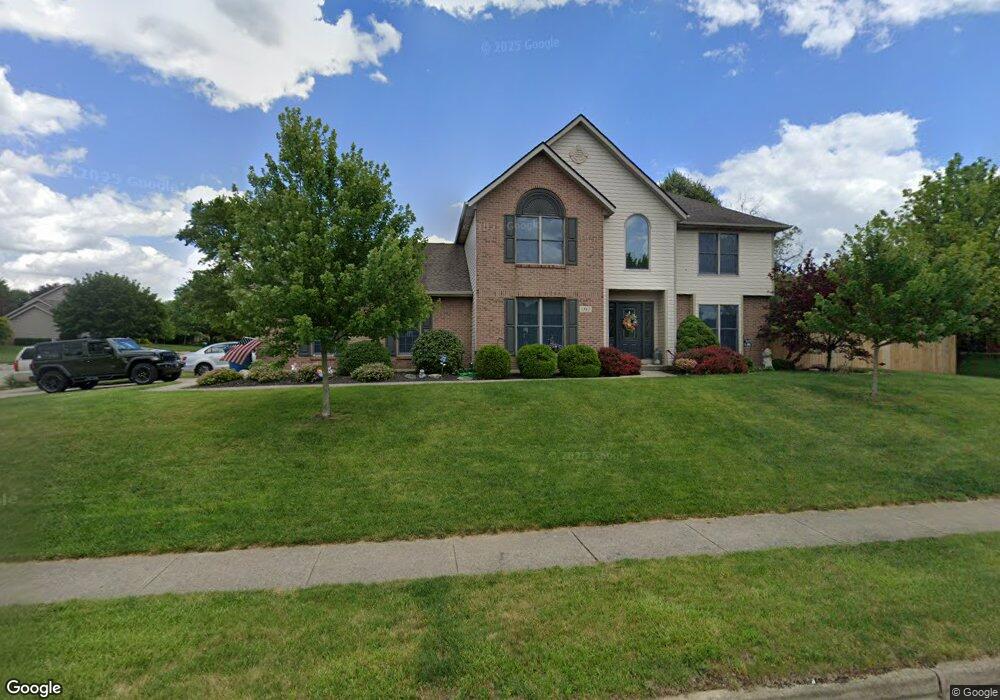
1382 Chevington Chase Tipp City, OH 45371
Estimated Value: $411,000 - $425,000
4
Beds
3
Baths
2,457
Sq Ft
$170/Sq Ft
Est. Value
About This Home
This home is located at 1382 Chevington Chase, Tipp City, OH 45371 and is currently estimated at $418,635, approximately $170 per square foot. 1382 Chevington Chase is a home located in Miami County with nearby schools including Broadway Elementary School, Nevin Coppock Elementary School, and L. T. Ball Intermediate School.
Ownership History
Date
Name
Owned For
Owner Type
Purchase Details
Closed on
Jun 29, 2023
Sold by
Rindler Randy L and Rindler Debra E
Bought by
Norberg Clayton Matthew and Norberg Laura Ryan
Current Estimated Value
Home Financials for this Owner
Home Financials are based on the most recent Mortgage that was taken out on this home.
Original Mortgage
$300,000
Outstanding Balance
$292,296
Interest Rate
6.39%
Mortgage Type
New Conventional
Estimated Equity
$126,339
Create a Home Valuation Report for This Property
The Home Valuation Report is an in-depth analysis detailing your home's value as well as a comparison with similar homes in the area
Home Values in the Area
Average Home Value in this Area
Purchase History
| Date | Buyer | Sale Price | Title Company |
|---|---|---|---|
| Norberg Clayton Matthew | $380,000 | None Listed On Document |
Source: Public Records
Mortgage History
| Date | Status | Borrower | Loan Amount |
|---|---|---|---|
| Open | Norberg Clayton Matthew | $300,000 |
Source: Public Records
Tax History Compared to Growth
Tax History
| Year | Tax Paid | Tax Assessment Tax Assessment Total Assessment is a certain percentage of the fair market value that is determined by local assessors to be the total taxable value of land and additions on the property. | Land | Improvement |
|---|---|---|---|---|
| 2024 | $4,885 | $98,140 | $20,930 | $77,210 |
| 2023 | $4,885 | $98,140 | $20,930 | $77,210 |
| 2022 | $4,453 | $98,140 | $20,930 | $77,210 |
| 2021 | $4,091 | $81,760 | $17,430 | $64,330 |
| 2020 | $4,142 | $81,760 | $17,430 | $64,330 |
| 2019 | $4,179 | $81,760 | $17,430 | $64,330 |
| 2018 | $4,152 | $75,810 | $19,530 | $56,280 |
| 2017 | $4,168 | $75,810 | $19,530 | $56,280 |
| 2016 | $4,028 | $75,810 | $19,530 | $56,280 |
| 2015 | $3,392 | $67,690 | $17,430 | $50,260 |
| 2014 | $3,392 | $67,690 | $17,430 | $50,260 |
| 2013 | $3,409 | $67,690 | $17,430 | $50,260 |
Source: Public Records
Map
Nearby Homes
- 1701 Chevington Chase
- 720 Pinehurst Dr
- 1216 Wind Rock Ct
- 425 Sydney Dr
- 1119 Honeydew Dr
- 1117 Honeydew Dr
- 660 Wisteria Dr
- 403 Sydney Dr
- Spruce Plan at Summit Landing
- Norway Plan at Summit Landing
- Chestnut Plan at Summit Landing
- Juniper Plan at Summit Landing
- Palmetto Plan at Summit Landing
- Ashton Plan at Summit Landing
- Empress Plan at Summit Landing
- Ironwood Plan at Summit Landing
- Aspen II Plan at Summit Landing
- Walnut Plan at Summit Landing
- Bradford Plan at Summit Landing
- Cooper Plan at Summit Landing
- 768 Stonehenge Dr
- 739 Stone Ridge Place
- 721 Stone Ridge Place
- 808 Stonehenge Dr
- 744 Stonehenge Dr
- 783 Stonehenge Dr
- 801 Stone Ridge Place
- 767 Stonehenge Dr
- 717 Stone Ridge Place
- 811 Stonehenge Dr
- 836 Stonehenge Dr
- 741 Stonehenge Dr
- 728 Stonehenge Dr
- 815 Stone Ridge Place
- 738 Stone Ridge Place
- 726 Dustin Ct
- 827 Stonehenge Dr
- 714 Dustin Ct
- 723 Stonehenge Dr
- 703 Stone Ridge Place