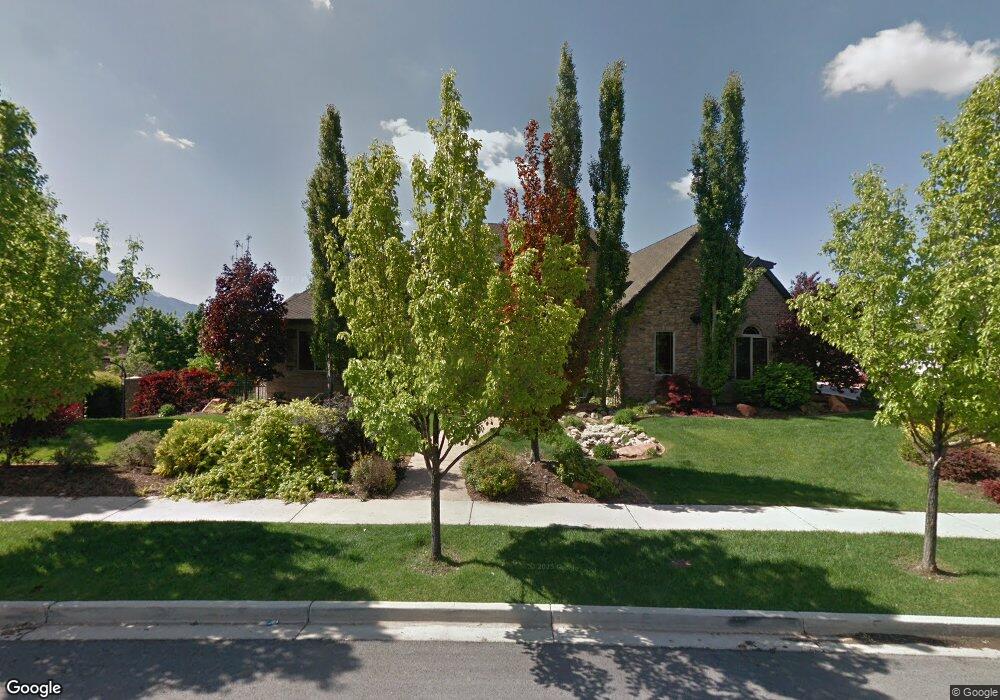
1382 E 1110 N Orem, UT 84097
Old Orchard NeighborhoodEstimated Value: $1,432,000 - $1,910,667
4
Beds
4
Baths
7,560
Sq Ft
$217/Sq Ft
Est. Value
About This Home
This home is located at 1382 E 1110 N, Orem, UT 84097 and is currently estimated at $1,637,889, approximately $216 per square foot. 1382 E 1110 N is a home located in Utah County with nearby schools including Foothill Elementary School, Canyon View Junior High School, and Orem High School.
Ownership History
Date
Name
Owned For
Owner Type
Purchase Details
Closed on
Dec 19, 2005
Sold by
Ross Construction Inc
Bought by
Thomson Tiffani K
Current Estimated Value
Home Financials for this Owner
Home Financials are based on the most recent Mortgage that was taken out on this home.
Original Mortgage
$165,000
Outstanding Balance
$92,702
Interest Rate
6.36%
Mortgage Type
Credit Line Revolving
Estimated Equity
$1,545,187
Purchase Details
Closed on
Dec 23, 2004
Sold by
Torgersen Hal and Torgersen Dorothy
Bought by
Ross Construction Inc
Purchase Details
Closed on
Apr 23, 2002
Sold by
Prime West Developers Lc
Bought by
Windsor Property Investments Lc
Create a Home Valuation Report for This Property
The Home Valuation Report is an in-depth analysis detailing your home's value as well as a comparison with similar homes in the area
Home Values in the Area
Average Home Value in this Area
Purchase History
| Date | Buyer | Sale Price | Title Company |
|---|---|---|---|
| Thomson Tiffani K | -- | Century Title Company | |
| Ross Construction Inc | -- | First American Title Agency | |
| Windsor Property Investments Lc | -- | First American Title Co |
Source: Public Records
Mortgage History
| Date | Status | Borrower | Loan Amount |
|---|---|---|---|
| Open | Thomson Tiffani K | $165,000 | |
| Open | Thomson Tiffani K | $825,000 |
Source: Public Records
Tax History
| Year | Tax Paid | Tax Assessment Tax Assessment Total Assessment is a certain percentage of the fair market value that is determined by local assessors to be the total taxable value of land and additions on the property. | Land | Improvement |
|---|---|---|---|---|
| 2025 | $6,595 | $864,105 | -- | -- |
| 2024 | $6,595 | $806,465 | $0 | $0 |
| 2023 | $5,966 | $784,025 | $0 | $0 |
| 2022 | $6,201 | $789,525 | $0 | $0 |
| 2021 | $6,137 | $1,183,500 | $420,800 | $762,700 |
| 2020 | $5,795 | $1,098,400 | $350,700 | $747,700 |
| 2019 | $5,536 | $1,091,100 | $350,700 | $740,400 |
| 2018 | $5,194 | $978,200 | $334,400 | $643,800 |
| 2017 | $5,333 | $538,010 | $0 | $0 |
| 2016 | $5,454 | $507,375 | $0 | $0 |
| 2015 | $5,245 | $461,395 | $0 | $0 |
| 2014 | $4,633 | $405,735 | $0 | $0 |
Source: Public Records
Map
Nearby Homes
- 566 N Bella Vista Dr
- 1324 N 750 E Unit 3
- 1356 N 750 E Unit 11
- 1366 N 750 E
- 710 E 1280 N
- 747 E 1500 N Unit 13
- 733 E 1450 N Unit 5
- 551 N 900 E
- 713 E 1500 St N Unit 19
- 713 E 1450 N Unit 23
- 1643 N Mountain Oaks Dr
- 976 N 560 E
- 723 E 1450 N Unit 25
- 5005 N Edgewood Dr Unit 310
- 453 N 650 E
- 471 E 700 N
- 80 N 1200 E
- 372 E 1165 N
- 540 E Quail Rd
- 695 E 1870 N
- 1382 E 1110 N Unit 20
- 1382 E Huntington Ridge Unit 20
- 1374 E 1110 N
- 1374 E 1110 N Unit 21
- 1377 E 1060 N
- 1377 E 1060 N Unit 23
- 1408 E 1110 N
- 1369 E 1060 N Unit 22
- 1369 E 1060 N
- 1403 Lancaster Way
- 1403 E 1060 N
- 1409 E 1110 N
- 1580 E 1110 N Unit 49
- 1122 N 1360 E Unit 16
- 1142 Somerset Dr
- 1376 E 1060 N
- 1434 E 1110 N Unit 26
- 1378 E 1060 N Unit 35
- 1083 N 1360 E
- 1406 E 1060 N Unit 34
Your Personal Tour Guide
Ask me questions while you tour the home.