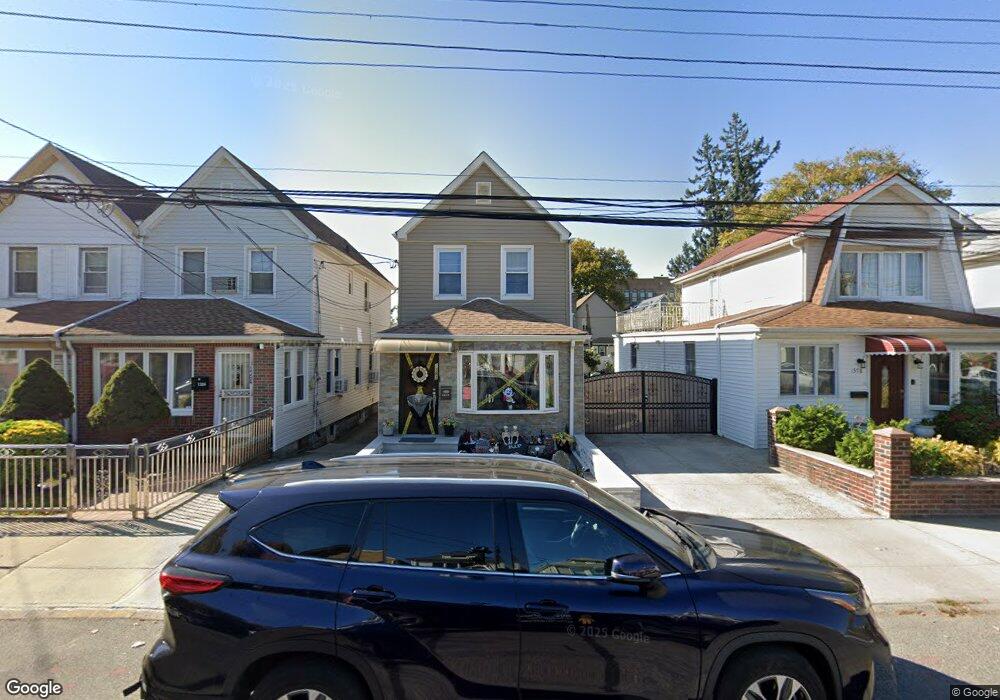
1382 E 58th St Brooklyn, NY 11234
Flatlands NeighborhoodEstimated Value: $690,318 - $798,000
3
Beds
3
Baths
1,110
Sq Ft
$680/Sq Ft
Est. Value
About This Home
This home is located at 1382 E 58th St, Brooklyn, NY 11234 and is currently estimated at $754,580, approximately $679 per square foot. 1382 E 58th St is a home located in Kings County with nearby schools including P.S. 203 Floyd Bennett, Success Academy Charter School - Bergen Beach, and Hebrew Language Academy.
Ownership History
Date
Name
Owned For
Owner Type
Purchase Details
Closed on
Mar 12, 2019
Sold by
Adk South Dr Corp
Bought by
Stewart Paula E and Stewart Shawana L
Current Estimated Value
Home Financials for this Owner
Home Financials are based on the most recent Mortgage that was taken out on this home.
Original Mortgage
$603,250
Outstanding Balance
$522,743
Interest Rate
4.4%
Mortgage Type
Purchase Money Mortgage
Estimated Equity
$231,837
Purchase Details
Closed on
May 24, 2018
Sold by
Hibbert Hyacinth and Hibbert Hyancinth
Bought by
Adk South Dr Corp
Home Financials for this Owner
Home Financials are based on the most recent Mortgage that was taken out on this home.
Original Mortgage
$300,000
Interest Rate
4.5%
Mortgage Type
Purchase Money Mortgage
Purchase Details
Closed on
Nov 15, 2001
Sold by
Francois Yvrose and Jerome Gerda
Bought by
Hibbert Hyancinth
Home Financials for this Owner
Home Financials are based on the most recent Mortgage that was taken out on this home.
Original Mortgage
$227,050
Interest Rate
6.66%
Create a Home Valuation Report for This Property
The Home Valuation Report is an in-depth analysis detailing your home's value as well as a comparison with similar homes in the area
Home Values in the Area
Average Home Value in this Area
Purchase History
We collect this data history from publicly available records. To have your information removed, we recommend requesting removal directly through your county’s website.
| Date | Buyer | Sale Price | Title Company |
|---|---|---|---|
| Stewart Paula E | $635,000 | -- | |
| Adk South Dr Corp | $345,000 | -- | |
| Hibbert Hyancinth | -- | -- |
Source: Public Records
Mortgage History
We collect this data history from publicly available records. To have your information removed, we recommend requesting removal directly through your county’s website.
| Date | Status | Borrower | Loan Amount |
|---|---|---|---|
| Open | Stewart Paula E | $603,250 | |
| Previous Owner | Adk South Dr Corp | $300,000 | |
| Previous Owner | Hibbert Hyancinth | $227,050 |
Source: Public Records
Tax History
| Year | Tax Paid | Tax Assessment Tax Assessment Total Assessment is a certain percentage of the fair market value that is determined by local assessors to be the total taxable value of land and additions on the property. | Land | Improvement |
|---|---|---|---|---|
| 2026 | $5,481 | $39,360 | $7,080 | $32,280 |
| 2025 | $5,171 | $36,180 | $7,080 | $29,100 |
| 2024 | $5,171 | $34,440 | $7,080 | $27,360 |
| 2023 | $5,124 | $38,760 | $7,080 | $31,680 |
| 2022 | $4,864 | $34,200 | $7,080 | $27,120 |
| 2021 | $5,073 | $33,900 | $7,080 | $26,820 |
| 2019 | $4,488 | $29,280 | $7,080 | $22,200 |
| 2018 | $4,286 | $21,024 | $5,256 | $15,768 |
| 2017 | $4,139 | $20,304 | $5,141 | $15,163 |
| 2016 | $4,016 | $20,089 | $5,685 | $14,404 |
| 2015 | $2,090 | $18,952 | $6,935 | $12,017 |
| 2014 | $2,090 | $17,880 | $7,860 | $10,020 |
Source: Public Records
Map
Nearby Homes
Your Personal Tour Guide
Ask me questions while you tour the home.