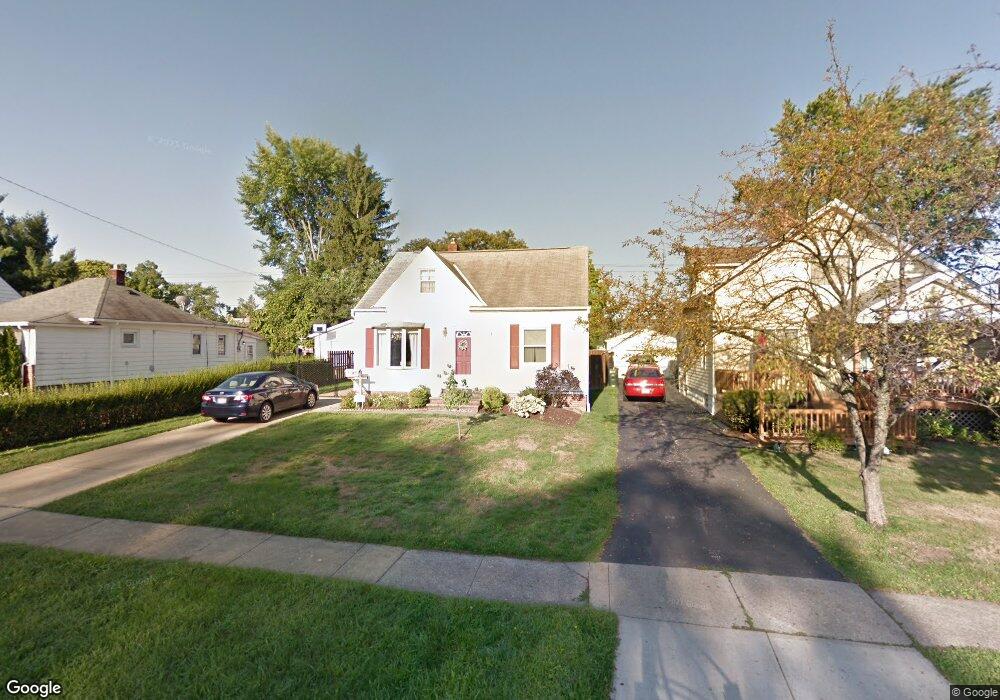
1382 Genesee Ave Cleveland, OH 44124
Estimated Value: $207,948 - $240,000
3
Beds
1
Bath
1,218
Sq Ft
$182/Sq Ft
Est. Value
About This Home
This home is located at 1382 Genesee Ave, Cleveland, OH 44124 and is currently estimated at $221,487, approximately $181 per square foot. 1382 Genesee Ave is a home located in Cuyahoga County with nearby schools including Mayfield High School, Corpus Christi Academy, and Gilmour Academy.
Ownership History
Date
Name
Owned For
Owner Type
Purchase Details
Closed on
Apr 25, 2015
Sold by
Hoyle Carrie A and Hoyle Cathy L
Bought by
Hoyle Carrie A
Current Estimated Value
Home Financials for this Owner
Home Financials are based on the most recent Mortgage that was taken out on this home.
Original Mortgage
$133,850
Outstanding Balance
$102,664
Interest Rate
3.64%
Mortgage Type
New Conventional
Estimated Equity
$118,823
Purchase Details
Closed on
Sep 28, 2009
Sold by
Gura Jo Ann and Gura Fred R
Bought by
Hoyle Carrie A and Hoyle Cathy L
Home Financials for this Owner
Home Financials are based on the most recent Mortgage that was taken out on this home.
Original Mortgage
$137,464
Interest Rate
5.38%
Mortgage Type
FHA
Purchase Details
Closed on
Jan 22, 1979
Sold by
Gura Jo Ann
Bought by
Jo Ann Gura
Purchase Details
Closed on
Feb 8, 1977
Sold by
Glassman Elizabeth P
Bought by
Gura Jo Ann
Purchase Details
Closed on
Jan 1, 1975
Bought by
Glassman Elizabeth P
Create a Home Valuation Report for This Property
The Home Valuation Report is an in-depth analysis detailing your home's value as well as a comparison with similar homes in the area
Home Values in the Area
Average Home Value in this Area
Purchase History
| Date | Buyer | Sale Price | Title Company |
|---|---|---|---|
| Hoyle Carrie A | $67,200 | Attorney | |
| Hoyle Carrie A | $140,000 | Attorney | |
| Jo Ann Gura | -- | -- | |
| Gura Jo Ann | -- | -- | |
| Glassman Elizabeth P | -- | -- |
Source: Public Records
Mortgage History
| Date | Status | Borrower | Loan Amount |
|---|---|---|---|
| Open | Hoyle Carrie A | $133,850 | |
| Closed | Hoyle Carrie A | $137,464 |
Source: Public Records
Tax History Compared to Growth
Tax History
| Year | Tax Paid | Tax Assessment Tax Assessment Total Assessment is a certain percentage of the fair market value that is determined by local assessors to be the total taxable value of land and additions on the property. | Land | Improvement |
|---|---|---|---|---|
| 2024 | $4,249 | $64,960 | $11,200 | $53,760 |
| 2023 | $4,061 | $55,870 | $10,190 | $45,680 |
| 2022 | $4,073 | $55,860 | $10,190 | $45,680 |
| 2021 | $4,030 | $55,860 | $10,190 | $45,680 |
| 2020 | $3,759 | $47,740 | $8,720 | $39,030 |
| 2019 | $3,642 | $136,400 | $24,900 | $111,500 |
| 2018 | $3,543 | $47,740 | $8,720 | $39,030 |
| 2017 | $3,807 | $47,040 | $7,700 | $39,340 |
| 2016 | $3,778 | $47,040 | $7,700 | $39,340 |
| 2015 | -- | $47,040 | $7,700 | $39,340 |
| 2014 | -- | $47,040 | $7,700 | $39,340 |
Source: Public Records
Map
Nearby Homes
- 1371 Commonwealth Ave
- 1336 Genesee Ave
- 1400 Genesee Ave
- 1297 E Miner Rd
- 0 Maplewood Rd
- 1355 Washington Blvd
- 1520 Fruitland Ave
- 1296 Sunset Rd
- 1379 Lander Rd
- 1542 Woodhurst Ave
- 1415 Lander Rd
- 1173 Commonwealth Ave
- 1296 Bonnie Ln
- 1572 Crestwood Rd
- 1337 Elmwood Rd
- 1604 Fruitland Ave
- 1328 Elmwood Rd
- 6248 S Woodlane Dr
- 6205 S Woodlane Dr
- 1637 Lander Rd
- 1386 Genesee Ave
- 1376 Genesee Ave
- 1390 Genesee Ave
- 1370 Genesee Ave
- 1381 Commonwealth Ave
- 1377 Commonwealth Ave
- 1389 Commonwealth Ave
- 1366 Genesee Ave
- 1396 Genesee Ave
- 1393 Commonwealth Ave
- 1381 Genesee Ave
- 1387 Genesee Ave
- 1377 Genesee Ave
- 1367 Commonwealth Ave
- 1397 Commonwealth Ave
- 1391 Genesee Ave
- 1373 Genesee Ave
- 1362 Genesee Ave
- 1397 Genesee Ave
- 1369 Genesee Ave