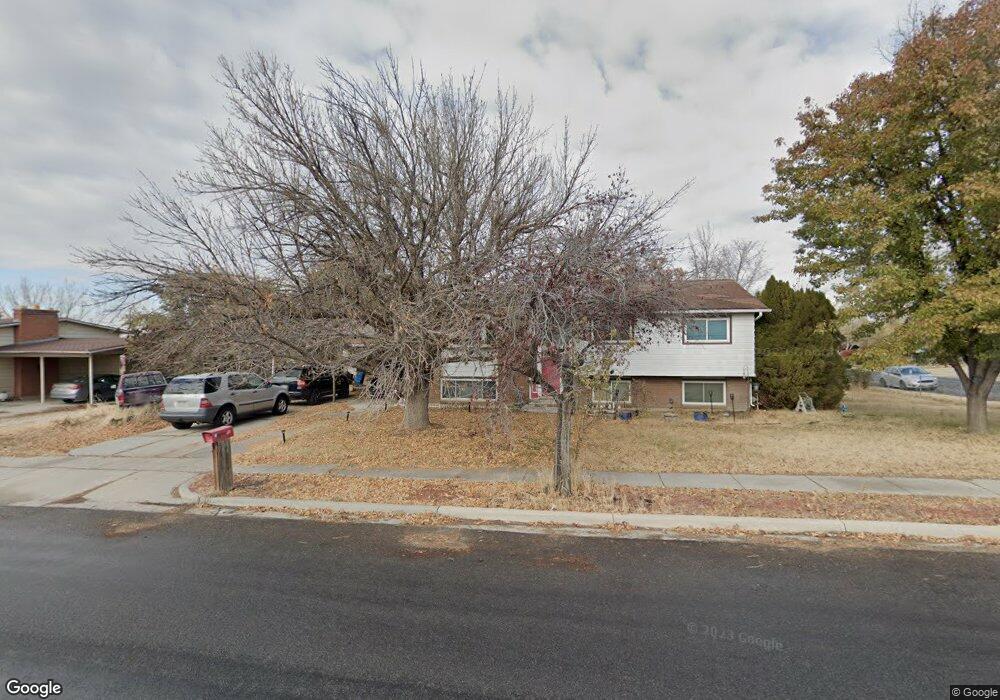
1382 W 2600 N Clearfield, UT 84015
Estimated Value: $384,000 - $476,000
4
Beds
2
Baths
1,221
Sq Ft
$349/Sq Ft
Est. Value
About This Home
This home is located at 1382 W 2600 N, Clearfield, UT 84015 and is currently estimated at $425,603, approximately $348 per square foot. 1382 W 2600 N is a home located in Davis County with nearby schools including Parkside Elementary School, Sunset Junior High School, and Clearfield High School.
Ownership History
Date
Name
Owned For
Owner Type
Purchase Details
Closed on
Jul 26, 2025
Sold by
Jorgensen Gunnar E
Bought by
Jorgensen Gunnar E and Melillo-Jorgensen Dakotah
Current Estimated Value
Home Financials for this Owner
Home Financials are based on the most recent Mortgage that was taken out on this home.
Original Mortgage
$253,357
Outstanding Balance
$253,135
Interest Rate
6.67%
Mortgage Type
FHA
Estimated Equity
$172,468
Purchase Details
Closed on
Feb 26, 1998
Sold by
Devore Zeth M and Devore Susan L
Bought by
Jorgensen Gunnar E and Jorgensen Laurette
Create a Home Valuation Report for This Property
The Home Valuation Report is an in-depth analysis detailing your home's value as well as a comparison with similar homes in the area
Home Values in the Area
Average Home Value in this Area
Purchase History
| Date | Buyer | Sale Price | Title Company |
|---|---|---|---|
| Jorgensen Gunnar E | -- | None Listed On Document | |
| Jorgensen Gunnar E | -- | U S Title |
Source: Public Records
Mortgage History
| Date | Status | Borrower | Loan Amount |
|---|---|---|---|
| Open | Jorgensen Gunnar E | $253,357 |
Source: Public Records
Tax History Compared to Growth
Tax History
| Year | Tax Paid | Tax Assessment Tax Assessment Total Assessment is a certain percentage of the fair market value that is determined by local assessors to be the total taxable value of land and additions on the property. | Land | Improvement |
|---|---|---|---|---|
| 2025 | $2,202 | $211,750 | $83,326 | $128,424 |
| 2024 | $2,157 | $208,450 | $91,848 | $116,602 |
| 2023 | $1,963 | $351,000 | $104,053 | $246,947 |
| 2022 | $2,090 | $206,800 | $64,199 | $142,601 |
| 2021 | $1,935 | $284,000 | $79,441 | $204,559 |
| 2020 | $1,680 | $244,000 | $67,014 | $176,986 |
| 2019 | $1,579 | $224,000 | $79,218 | $144,782 |
| 2018 | $1,463 | $204,000 | $67,029 | $136,971 |
| 2016 | $1,349 | $97,131 | $25,999 | $71,132 |
| 2015 | $1,229 | $84,151 | $25,999 | $58,152 |
| 2014 | $1,172 | $81,497 | $25,999 | $55,498 |
| 2013 | -- | $79,317 | $25,230 | $54,087 |
Source: Public Records
Map
Nearby Homes