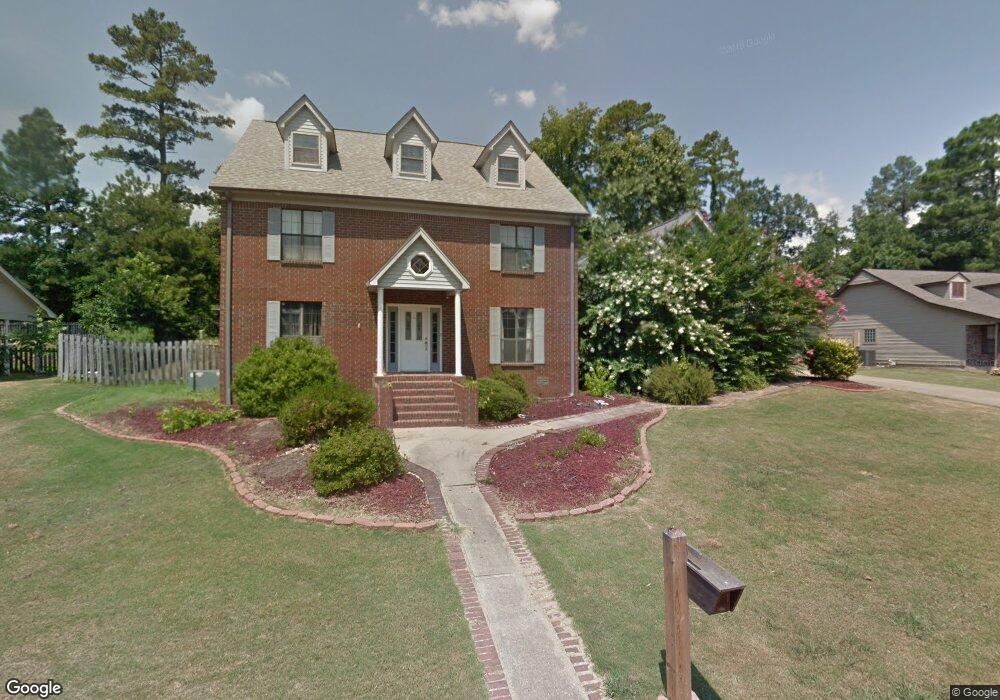
13820 Wimbledon Loop Little Rock, AR 72210
Otter Creek NeighborhoodEstimated Value: $332,000 - $379,000
--
Bed
4
Baths
3,895
Sq Ft
$92/Sq Ft
Est. Value
About This Home
This home is located at 13820 Wimbledon Loop, Little Rock, AR 72210 and is currently estimated at $356,508, approximately $91 per square foot. 13820 Wimbledon Loop is a home located in Pulaski County with nearby schools including Otter Creek Elementary School, Mabelvale Middle School, and Little Rock Southwest High School.
Ownership History
Date
Name
Owned For
Owner Type
Purchase Details
Closed on
Jan 21, 2025
Sold by
Commissioner Of State Lands
Bought by
Hogan Jabari and Hogan Cathey Victoria
Current Estimated Value
Purchase Details
Closed on
Jan 30, 2012
Sold by
Brown Jeff and Brown Aliza
Bought by
Hogan Jabari and Cathey Victoria
Home Financials for this Owner
Home Financials are based on the most recent Mortgage that was taken out on this home.
Original Mortgage
$194,900
Interest Rate
4%
Mortgage Type
Future Advance Clause Open End Mortgage
Purchase Details
Closed on
Aug 20, 1999
Sold by
Filbeck Kenneth J and Filbeck Linda S
Bought by
Brown Jeff and Brown Aliza
Home Financials for this Owner
Home Financials are based on the most recent Mortgage that was taken out on this home.
Original Mortgage
$140,000
Interest Rate
7.68%
Mortgage Type
Purchase Money Mortgage
Create a Home Valuation Report for This Property
The Home Valuation Report is an in-depth analysis detailing your home's value as well as a comparison with similar homes in the area
Home Values in the Area
Average Home Value in this Area
Purchase History
| Date | Buyer | Sale Price | Title Company |
|---|---|---|---|
| Hogan Jabari | $16,349 | None Listed On Document | |
| Hogan Jabari | $219,000 | Lenders Title Company | |
| Brown Jeff | $150,000 | First National Title Company |
Source: Public Records
Mortgage History
| Date | Status | Borrower | Loan Amount |
|---|---|---|---|
| Previous Owner | Hogan Jabari | $194,900 | |
| Previous Owner | Brown Jeff | $140,000 |
Source: Public Records
Tax History Compared to Growth
Tax History
| Year | Tax Paid | Tax Assessment Tax Assessment Total Assessment is a certain percentage of the fair market value that is determined by local assessors to be the total taxable value of land and additions on the property. | Land | Improvement |
|---|---|---|---|---|
| 2025 | $4,113 | $60,465 | $8,800 | $51,665 |
| 2024 | $3,770 | $60,465 | $8,800 | $51,665 |
| 2023 | $3,770 | $60,465 | $8,800 | $51,665 |
| 2022 | $3,599 | $60,465 | $8,800 | $51,665 |
| 2021 | $3,452 | $48,960 | $9,400 | $39,560 |
| 2020 | $3,052 | $48,960 | $9,400 | $39,560 |
| 2019 | $3,052 | $48,960 | $9,400 | $39,560 |
| 2018 | $3,427 | $48,960 | $9,400 | $39,560 |
| 2017 | $3,427 | $48,960 | $9,400 | $39,560 |
| 2016 | $3,692 | $52,740 | $10,950 | $41,790 |
| 2015 | $3,697 | $52,740 | $10,950 | $41,790 |
| 2014 | $3,697 | $52,740 | $10,950 | $41,790 |
Source: Public Records
Map
Nearby Homes
- 7 Connolly Ct
- 7 Tracy Austin Ct
- 29 Lendl Loop
- 78 Laver Cir
- 17 Laver Cir
- 7 Agassi Ct
- 78 Westfield Loop
- 16107 Otter Creek Pkwy
- 12 Westfield Dr
- 18021 Fawn Tree Dr
- Lot 1 & 3 Stagecoach Rd
- Lot 22 the Arbors at Stagecoach Village
- Lot 23 the Arbors at Stagecoach Village
- 15 Butterfly Cove
- 11 Hickory Ct
- 11015 Dogwood Cove
- 18310 Fawn Tree Dr
- 2521 Grapevine Dr
- 1 Otter Creek
- 13513 Otter Creek
- 13900 Wimbledon Loop
- 13816 Wimbledon Loop
- 15 Arnold Palmer Cove
- 11 Arnold Palmer Cove
- 13902 Wimbledon Loop
- 13812 Wimbledon Loop
- 112 Laver Cir
- 13815 Wimbledon Loop
- 9 Arnold Palmer Cove
- 13811 Wimbledon Loop
- 13904 Wimbledon Loop
- 19 Arnold Palmer Cove
- 13808 Wimbledon Loop
- 110 Laver Cir
- 7 Arnold Palmer Cove
- 3 Connolly Ct
- 13906 Wimbledon Loop
- 13800 Wimbledon Loop
- 13905 Wimbledon Loop
- 5 Arnold Palmer Cove