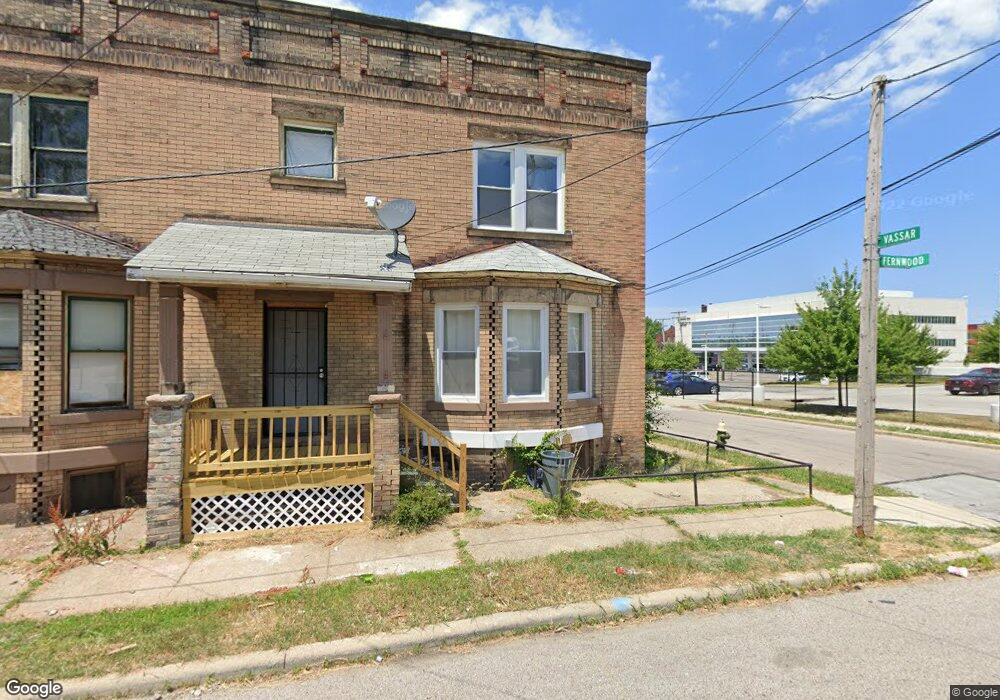
13825 Fernwood Ave Cleveland, OH 44112
Estimated Value: $59,484 - $148,000
3
Beds
1
Bath
1,338
Sq Ft
$64/Sq Ft
Est. Value
About This Home
This home is located at 13825 Fernwood Ave, Cleveland, OH 44112 and is currently estimated at $85,621, approximately $63 per square foot. 13825 Fernwood Ave is a home located in Cuyahoga County with nearby schools including Shaw High School and Citizens Academy.
Ownership History
Date
Name
Owned For
Owner Type
Purchase Details
Closed on
May 16, 2019
Sold by
Wilson James
Bought by
Wilson Joshua
Current Estimated Value
Purchase Details
Closed on
May 13, 2019
Sold by
The City Of East Cleveland
Bought by
Wilson James
Purchase Details
Closed on
Aug 21, 2018
Sold by
The Cuyahoga County Land Reutilization C
Bought by
City Of East Cleveland
Purchase Details
Closed on
Aug 16, 2018
Sold by
Kennedy Dennis G
Bought by
Cuyhoga County Land Reutilization Corp
Purchase Details
Closed on
Apr 22, 2016
Sold by
East Cleveland Renaissance Development C
Bought by
Wilson James
Purchase Details
Closed on
Dec 4, 2013
Sold by
Lennon Rev Richard G
Bought by
East Cleveland Renaissance Development C
Purchase Details
Closed on
Jun 1, 1984
Sold by
Collier Marguerite S
Bought by
Bishop Catholic Diocese
Purchase Details
Closed on
Jan 1, 1975
Bought by
Collier Marguerite S
Create a Home Valuation Report for This Property
The Home Valuation Report is an in-depth analysis detailing your home's value as well as a comparison with similar homes in the area
Home Values in the Area
Average Home Value in this Area
Purchase History
| Date | Buyer | Sale Price | Title Company |
|---|---|---|---|
| Wilson Joshua | $7,400 | None Available | |
| Wilson James | -- | None Available | |
| City Of East Cleveland | -- | None Available | |
| Cuyhoga County Land Reutilization Corp | -- | None Available | |
| Wilson James | $3,559 | Attorney | |
| East Cleveland Renaissance Development C | -- | Attorney | |
| Bishop Catholic Diocese | $10,500 | -- | |
| Collier Marguerite S | -- | -- |
Source: Public Records
Tax History Compared to Growth
Tax History
| Year | Tax Paid | Tax Assessment Tax Assessment Total Assessment is a certain percentage of the fair market value that is determined by local assessors to be the total taxable value of land and additions on the property. | Land | Improvement |
|---|---|---|---|---|
| 2024 | $520 | $7,000 | $1,890 | $5,110 |
| 2023 | $329 | $2,560 | $420 | $2,140 |
| 2022 | $236 | $2,560 | $420 | $2,140 |
| 2021 | $234 | $2,560 | $420 | $2,140 |
| 2020 | $255 | $2,590 | $420 | $2,170 |
| 2019 | $267 | $7,400 | $1,200 | $6,200 |
| 2018 | $113 | $2,590 | $420 | $2,170 |
| 2017 | $772 | $7,740 | $1,400 | $6,340 |
| 2016 | $785 | $7,740 | $1,400 | $6,340 |
| 2015 | $2,912 | $7,740 | $1,400 | $6,340 |
| 2014 | -- | $9,110 | $1,650 | $7,460 |
Source: Public Records
Map
Nearby Homes
- 1818 Knowles St
- 1720 Debra Ann Ln
- 1521 Lakefront Ave
- 1198 Rozelle Ave
- 1827 Idlewood Ave
- 1007 E 131st St
- 1679 Lockwood Ave
- 1229 Melbourne Rd
- 13509 4th Ave
- 990 E 129th St
- 1677 Carlyon Rd
- 1184 Melbourne Rd
- 974 E 129th St
- 1003 Eddy Rd
- 1546 Glenmont Rd
- 14012 Scioto Ave
- 1217 E 125th St
- 1069 Carlyon Rd
- 2090 Newbury Dr
- 14414 Scioto Ave
- 13823 Fernwood Ave
- 13821 Fernwood Ave
- 13819 Fernwood Ave
- 13817 Fernwood Ave
- 13813 Fernwood Ave
- 13824 Euclid Ave
- 13720 Fernwood Ave
- 1826 Wellesley Ave
- 1838 Wellesley Ave
- 1834 Wellesley Ave
- 1830 Wellesley Ave
- 1822 Wellesley Ave
- 13716 Fernwood Ave
- 1820 Wellesley Ave
- 1818 Wellesley Ave
- 1816 Wellesley Ave
- 13740 Euclid Ave
- 13738 Euclid Ave
- 13708 Fernwood Ave
- 13736 Euclid Ave