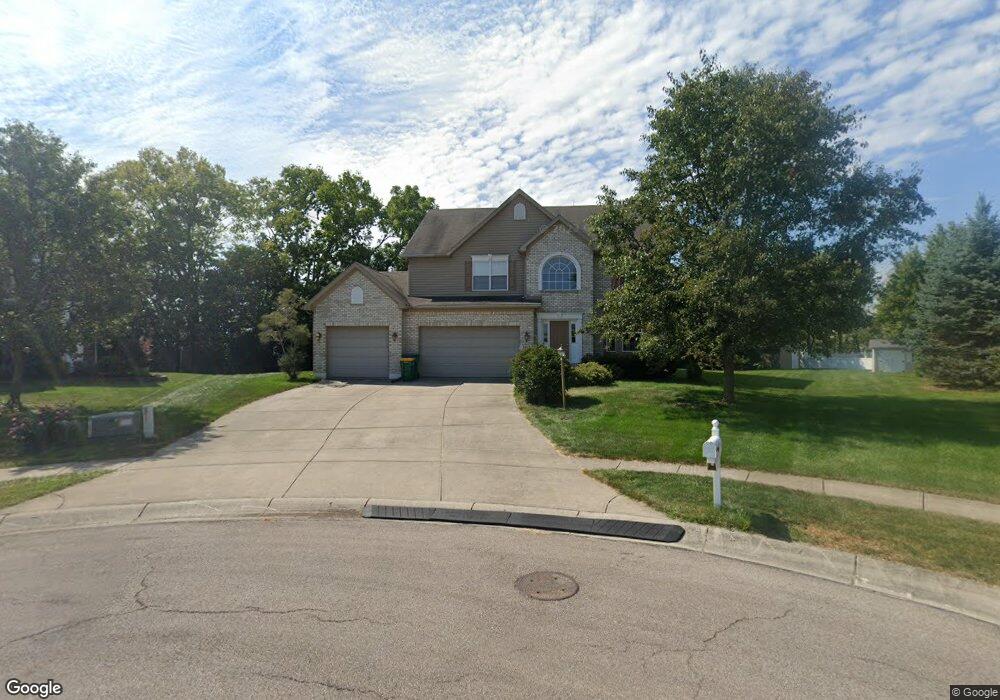
1383 Show Ct Beavercreek Township, OH 45434
Estimated Value: $480,238 - $532,000
4
Beds
4
Baths
2,598
Sq Ft
$195/Sq Ft
Est. Value
About This Home
This home is located at 1383 Show Ct, Beavercreek Township, OH 45434 and is currently estimated at $505,810, approximately $194 per square foot. 1383 Show Ct is a home located in Greene County with nearby schools including Trebein Elementary School, Jacob Coy Middle School, and Beavercreek High School.
Ownership History
Date
Name
Owned For
Owner Type
Purchase Details
Closed on
Nov 1, 2023
Sold by
Laferty Edward A and Laferty Penny M
Bought by
Laferty Revocable Trust and Laferty
Current Estimated Value
Purchase Details
Closed on
May 19, 2010
Sold by
Stapp Steven L and Stapp Jennifer L
Bought by
Laferty Edward A and Laferty Penny M
Home Financials for this Owner
Home Financials are based on the most recent Mortgage that was taken out on this home.
Original Mortgage
$75,500
Interest Rate
5.3%
Mortgage Type
New Conventional
Purchase Details
Closed on
Jun 22, 2006
Sold by
M L Huddleston Construction Co Inc
Bought by
Stapp Steven L and Stapp Jennifer L
Home Financials for this Owner
Home Financials are based on the most recent Mortgage that was taken out on this home.
Original Mortgage
$42,900
Interest Rate
6.68%
Mortgage Type
Purchase Money Mortgage
Create a Home Valuation Report for This Property
The Home Valuation Report is an in-depth analysis detailing your home's value as well as a comparison with similar homes in the area
Home Values in the Area
Average Home Value in this Area
Purchase History
| Date | Buyer | Sale Price | Title Company |
|---|---|---|---|
| Laferty Revocable Trust | -- | None Listed On Document | |
| Laferty Edward A | $297,500 | Attorney | |
| Stapp Steven L | $286,300 | Sterling Land Title Agency I | |
| M L Huddleston Construction Co Inc | -- | None Available |
Source: Public Records
Mortgage History
| Date | Status | Borrower | Loan Amount |
|---|---|---|---|
| Previous Owner | Laferty Edward A | $75,500 | |
| Previous Owner | M L Huddleston Construction Co Inc | $42,900 | |
| Previous Owner | Stapp Steven L | $228,950 |
Source: Public Records
Tax History Compared to Growth
Tax History
| Year | Tax Paid | Tax Assessment Tax Assessment Total Assessment is a certain percentage of the fair market value that is determined by local assessors to be the total taxable value of land and additions on the property. | Land | Improvement |
|---|---|---|---|---|
| 2024 | $6,846 | $141,330 | $27,500 | $113,830 |
| 2023 | $6,846 | $141,330 | $27,500 | $113,830 |
| 2022 | $7,252 | $110,710 | $22,000 | $88,710 |
| 2021 | $7,324 | $110,710 | $22,000 | $88,710 |
| 2020 | $7,444 | $110,710 | $22,000 | $88,710 |
| 2019 | $7,444 | $102,840 | $19,190 | $83,650 |
| 2018 | $6,509 | $102,840 | $19,190 | $83,650 |
| 2017 | $6,352 | $102,840 | $19,190 | $83,650 |
| 2016 | $6,265 | $97,630 | $19,190 | $78,440 |
| 2015 | $3,152 | $97,630 | $19,190 | $78,440 |
| 2014 | $6,162 | $97,630 | $19,190 | $78,440 |
Source: Public Records
Map
Nearby Homes
- 2245 Tourney Trail
- 1535 Stretch Dr
- 1361 Obetz Dr Unit A
- 1394 Crown Point Ct
- 2331 Eastwind Dr
- 2073 Lincolnshire Dr
- 2154 Sulky Trail
- 2162 Sulky Trail
- 1360 Backridge Ct
- 1238 Freedom Point
- 2507 Obetz Dr
- 1210 Lomeda Ln
- 1051 Forest Dr
- 1482 Fudge Dr
- 1359 Fudge Dr
- 895 Alpha Rd
- 2162 Owen E
- 2418 Owen W
- 2570 Mardella Dr
- 887 Shady Ln
- 1387 Show Ct
- 2246 Tourney Trail
- 2236 Tourney Trail
- 1380 Show Ct
- 2254 Tourney Trail
- 1372 Windsor Dr
- 1382 Windsor Dr
- 2226 Tourney Trail
- 1390 Windsor Dr
- 2251 Raceway Trail
- 2221 Raceway Trail
- 1397 Show Ct
- 1356 Windsor Dr
- 2215 Raceway Trail
- 2259 Raceway Trail
- 2209 Raceway Trail
- 2206 Tourney Trail
- 2203 Raceway Trail
- 2253 Tourney Trail
- 1375 Windsor Dr