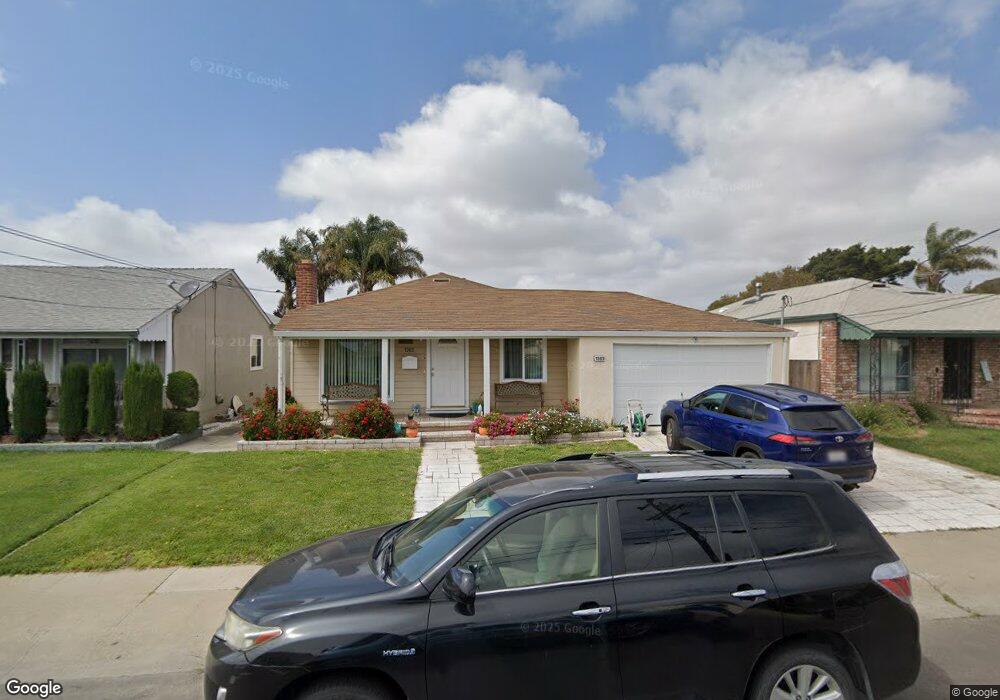
1383 Via San Juan San Lorenzo, CA 94580
Estimated Value: $912,000 - $992,000
4
Beds
2
Baths
1,600
Sq Ft
$590/Sq Ft
Est. Value
About This Home
This home is located at 1383 Via San Juan, San Lorenzo, CA 94580 and is currently estimated at $943,765, approximately $589 per square foot. 1383 Via San Juan is a home located in Alameda County with nearby schools including Bay Elementary School, Bohannon Middle School, and Arroyo High School.
Ownership History
Date
Name
Owned For
Owner Type
Purchase Details
Closed on
Nov 13, 2012
Sold by
Lal Lalita
Bought by
Lal Lalita and Lal Robert
Current Estimated Value
Purchase Details
Closed on
Apr 23, 2012
Sold by
Elias Alvaro and Elias Consuelo
Bought by
Lal Lalita
Home Financials for this Owner
Home Financials are based on the most recent Mortgage that was taken out on this home.
Original Mortgage
$165,000
Outstanding Balance
$113,913
Interest Rate
3.9%
Mortgage Type
Purchase Money Mortgage
Estimated Equity
$829,852
Purchase Details
Closed on
Aug 16, 2006
Sold by
Evans Thomas James and Evans Barbara Lee
Bought by
Elias Alvaro and Elias Consuelo
Home Financials for this Owner
Home Financials are based on the most recent Mortgage that was taken out on this home.
Original Mortgage
$536,000
Interest Rate
6.37%
Mortgage Type
Purchase Money Mortgage
Create a Home Valuation Report for This Property
The Home Valuation Report is an in-depth analysis detailing your home's value as well as a comparison with similar homes in the area
Home Values in the Area
Average Home Value in this Area
Purchase History
| Date | Buyer | Sale Price | Title Company |
|---|---|---|---|
| Lal Lalita | -- | None Available | |
| Lal Lalita | $345,000 | North American Title Company | |
| Elias Alvaro | $670,000 | First American Title Co |
Source: Public Records
Mortgage History
| Date | Status | Borrower | Loan Amount |
|---|---|---|---|
| Open | Lal Lalita | $165,000 | |
| Previous Owner | Elias Alvaro | $536,000 |
Source: Public Records
Tax History Compared to Growth
Tax History
| Year | Tax Paid | Tax Assessment Tax Assessment Total Assessment is a certain percentage of the fair market value that is determined by local assessors to be the total taxable value of land and additions on the property. | Land | Improvement |
|---|---|---|---|---|
| 2025 | $5,798 | $429,866 | $129,994 | $306,872 |
| 2024 | $5,798 | $421,303 | $127,446 | $300,857 |
| 2023 | $5,774 | $419,907 | $124,948 | $294,959 |
| 2022 | $5,683 | $404,674 | $122,498 | $289,176 |
| 2021 | $5,524 | $396,604 | $120,097 | $283,507 |
| 2020 | $5,402 | $399,468 | $118,866 | $280,602 |
| 2019 | $5,404 | $391,638 | $116,536 | $275,102 |
| 2018 | $5,091 | $383,962 | $114,252 | $269,710 |
| 2017 | $4,859 | $376,435 | $112,012 | $264,423 |
| 2016 | $4,600 | $366,054 | $109,816 | $256,238 |
| 2015 | $4,498 | $360,558 | $108,167 | $252,391 |
| 2014 | $4,431 | $353,497 | $106,049 | $247,448 |
Source: Public Records
Map
Nearby Homes
- 1311 Via Manzanas
- 1338 Via la Paloma
- 1575 Via Lucas
- 17069 Via Chiquita
- 16050 Via Olinda
- 1608 Keller Ave
- 15967 Paseo Del Campo
- 0 E 14th St Unit 41059501
- 1631 Via Ventana
- 16011 Via Conejo
- 1655 Via Escondido
- 1766 Via Redondo
- 17354 Via el Cerrito
- 17316 Via Flores
- 1781 Via Rancho
- 17347 Via Encinas
- 1867 Via Buena Vista
- 15771 Via Nueva
- 987 Via Bregani
- 15867 Hesperian Blvd
- 1395 Via San Juan
- 1371 Via San Juan
- 1359 Via San Juan
- 1407 Via San Juan
- 1388 Via el Monte
- 1398 Via el Monte
- 1376 Via el Monte
- 1419 Via San Juan
- 1347 Via San Juan
- 1412 Via el Monte
- 1364 Via el Monte
- 1386 Via San Juan
- 1374 Via San Juan
- 1396 Via San Juan
- 1424 Via el Monte
- 1360 Via San Juan
- 1431 Via San Juan
- 1337 Via San Juan
- 1352 Via el Monte
- 1337 Vía San Juan