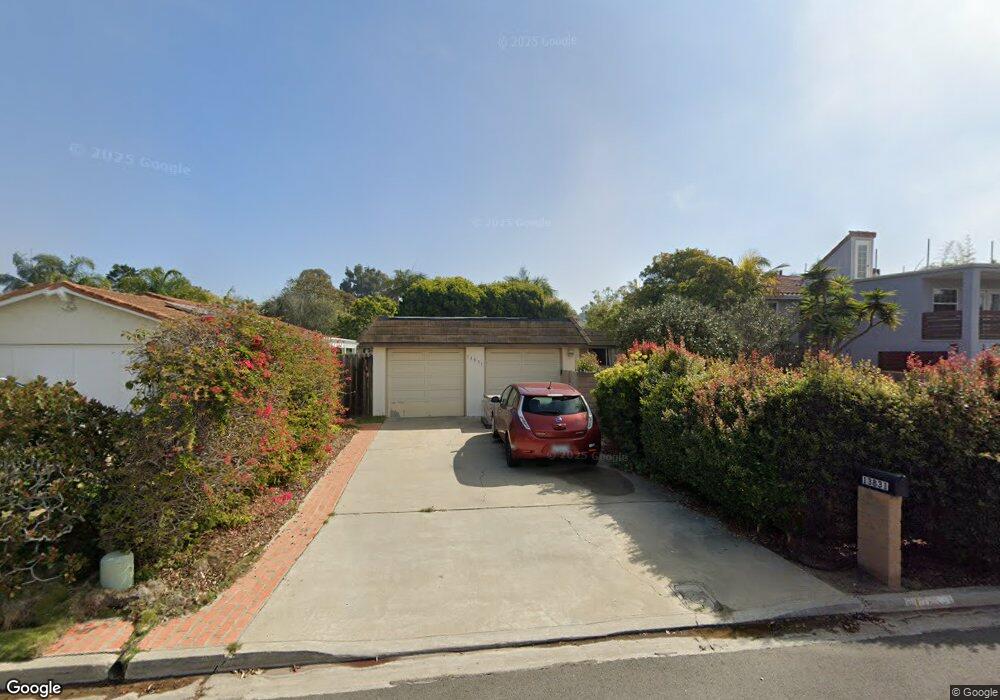
13831 Durango Dr Del Mar, CA 92014
Del Mar Heights NeighborhoodEstimated Value: $2,136,482 - $2,315,000
3
Beds
2
Baths
1,773
Sq Ft
$1,271/Sq Ft
Est. Value
About This Home
This home is located at 13831 Durango Dr, Del Mar, CA 92014 and is currently estimated at $2,253,871, approximately $1,271 per square foot. 13831 Durango Dr is a home located in San Diego County with nearby schools including Del Mar Heights School, Del Mar Hills Elementary School, and Earl Warren Middle School.
Ownership History
Date
Name
Owned For
Owner Type
Purchase Details
Closed on
Mar 26, 2024
Sold by
Fahy James Benjamin
Bought by
Fahy James Benjamin
Current Estimated Value
Home Financials for this Owner
Home Financials are based on the most recent Mortgage that was taken out on this home.
Original Mortgage
$700,000
Outstanding Balance
$689,321
Interest Rate
6.77%
Mortgage Type
Construction
Estimated Equity
$1,564,550
Purchase Details
Closed on
Aug 10, 2005
Sold by
Fahy Xinhua
Bought by
Fahy James Benjamin
Purchase Details
Closed on
May 11, 1998
Sold by
Strickland Nelson A
Bought by
Fahy James Benjamin
Home Financials for this Owner
Home Financials are based on the most recent Mortgage that was taken out on this home.
Original Mortgage
$400,000
Interest Rate
7.06%
Purchase Details
Closed on
Sep 27, 1988
Create a Home Valuation Report for This Property
The Home Valuation Report is an in-depth analysis detailing your home's value as well as a comparison with similar homes in the area
Home Values in the Area
Average Home Value in this Area
Purchase History
| Date | Buyer | Sale Price | Title Company |
|---|---|---|---|
| Fahy James Benjamin | -- | Ticor Title - San Diego Branch | |
| Fahy James Benjamin | -- | Chicago Title Co | |
| Fahy James Benjamin | $458,000 | Guardian Title | |
| -- | $313,500 | -- |
Source: Public Records
Mortgage History
| Date | Status | Borrower | Loan Amount |
|---|---|---|---|
| Open | Fahy James Benjamin | $700,000 | |
| Previous Owner | Fahy James Benjamin | $400,000 |
Source: Public Records
Tax History
| Year | Tax Paid | Tax Assessment Tax Assessment Total Assessment is a certain percentage of the fair market value that is determined by local assessors to be the total taxable value of land and additions on the property. | Land | Improvement |
|---|---|---|---|---|
| 2025 | $7,521 | $717,995 | $533,016 | $184,979 |
| 2024 | $7,521 | $703,917 | $522,565 | $181,352 |
| 2023 | $7,353 | $690,116 | $512,319 | $177,797 |
| 2022 | $7,233 | $676,585 | $502,274 | $174,311 |
| 2021 | $6,965 | $663,320 | $492,426 | $170,894 |
| 2020 | $7,025 | $656,519 | $487,377 | $169,142 |
| 2019 | $6,885 | $643,647 | $477,821 | $165,826 |
| 2018 | $6,580 | $631,027 | $468,452 | $162,575 |
| 2017 | $6,454 | $618,655 | $459,267 | $159,388 |
| 2016 | $6,241 | $606,525 | $450,262 | $156,263 |
| 2015 | $6,147 | $597,415 | $443,499 | $153,916 |
| 2014 | $6,019 | $585,713 | $434,812 | $150,901 |
Source: Public Records
Map
Nearby Homes
- 13814 Recuerdo Dr
- 13751 Mercado Dr
- 13721 Pine Needles Dr
- 13635 Pine Needles Dr
- 2582 Del Mar Heights Rd Unit 17
- 13754 Mango Dr Unit 123
- 13754 Mango Dr Unit 315
- 13754 Mango Dr Unit 316
- 13995 Mira Montana Dr
- 2029 Del Mar Heights Rd
- 271 Ocean View Ave
- 00000 Hidden Pines Rd
- 354 Ocean View Ave
- 3510 Voyager Cir Unit 67
- 555 Amphitheatre Dr
- 1141 Luneta Dr
- 3524 Seahorn Cir
- 13297 Portofino Dr
- 119 10th St
- 2191 Caminito Del Barco
- 13823 Durango Dr
- 13821 Durango Dr
- 13841 Durango Dr
- 13811 Durango Dr
- 13851 Durango Dr
- 13801 Durango Dr
- 13834 Recuerdo Dr
- 13861 Durango Dr
- 13824 Recuerdo Dr
- 13844 Recuerdo Dr
- 13854 Recuerdo Dr
- 13871 Durango Dr
- 13804 Recuerdo Dr
- 13864 Recuerdo Dr
- 13874 Recuerdo Dr
- 13881 Durango Dr
- 13795 Durango Dr
- 13884 Recuerdo Dr
- 13891 Durango Dr
- 13794 Recuerdo Dr
Your Personal Tour Guide
Ask me questions while you tour the home.