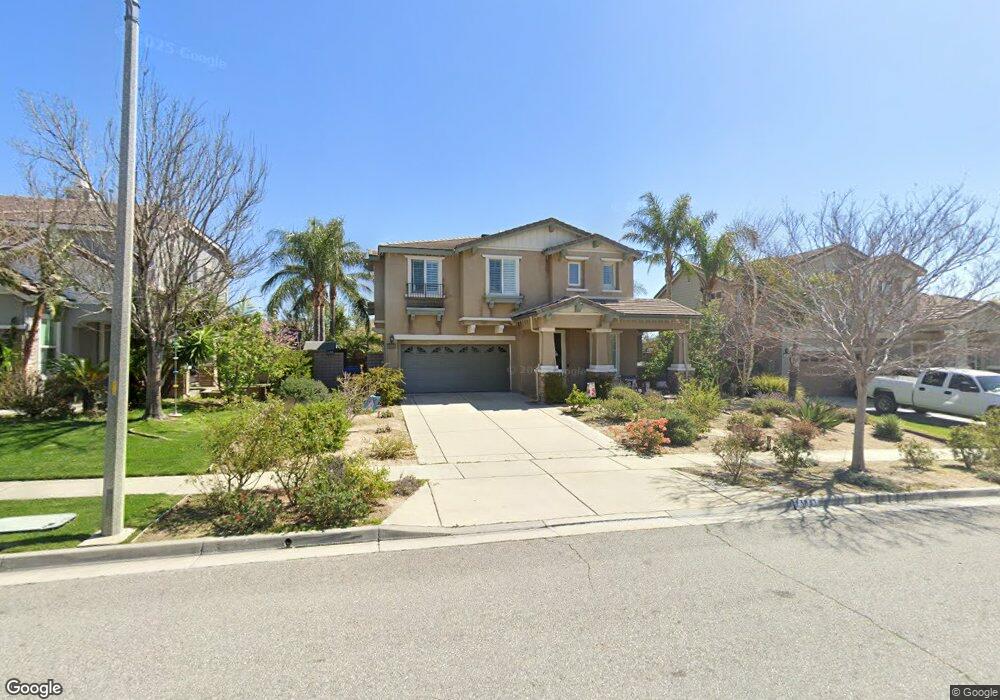
13831 Hummingbird Way Rancho Cucamonga, CA 91739
Etiwanda NeighborhoodEstimated Value: $888,743 - $1,011,000
4
Beds
3
Baths
2,378
Sq Ft
$397/Sq Ft
Est. Value
About This Home
This home is located at 13831 Hummingbird Way, Rancho Cucamonga, CA 91739 and is currently estimated at $944,436, approximately $397 per square foot. 13831 Hummingbird Way is a home located in San Bernardino County with nearby schools including Etiwanda Colony Elementary, Summit Intermediate, and Etiwanda High.
Ownership History
Date
Name
Owned For
Owner Type
Purchase Details
Closed on
Jan 26, 2010
Sold by
Beechler Patricia L
Bought by
Beechler Patricia L and Patricia L Beechler Trust
Current Estimated Value
Purchase Details
Closed on
Jul 28, 2009
Sold by
Hsbc Bank Usa National Association
Bought by
Beechler Patricia L
Home Financials for this Owner
Home Financials are based on the most recent Mortgage that was taken out on this home.
Original Mortgage
$265,300
Outstanding Balance
$171,915
Interest Rate
5.09%
Mortgage Type
Purchase Money Mortgage
Estimated Equity
$772,521
Purchase Details
Closed on
May 18, 2009
Sold by
Gonzalez Roberto C
Bought by
Hsbc Bank Usa National Association
Purchase Details
Closed on
Oct 5, 2006
Sold by
Pulte Home Corp
Bought by
Gonzalez Roberto C
Home Financials for this Owner
Home Financials are based on the most recent Mortgage that was taken out on this home.
Original Mortgage
$428,332
Interest Rate
6.25%
Mortgage Type
New Conventional
Create a Home Valuation Report for This Property
The Home Valuation Report is an in-depth analysis detailing your home's value as well as a comparison with similar homes in the area
Home Values in the Area
Average Home Value in this Area
Purchase History
| Date | Buyer | Sale Price | Title Company |
|---|---|---|---|
| Beechler Patricia L | -- | None Available | |
| Beechler Patricia L | $379,000 | Landsafe Title | |
| Hsbc Bank Usa National Association | $328,500 | Landsafe Title | |
| Gonzalez Roberto C | $535,500 | First American Title Company |
Source: Public Records
Mortgage History
| Date | Status | Borrower | Loan Amount |
|---|---|---|---|
| Open | Beechler Patricia L | $265,300 | |
| Previous Owner | Gonzalez Roberto C | $428,332 |
Source: Public Records
Tax History Compared to Growth
Tax History
| Year | Tax Paid | Tax Assessment Tax Assessment Total Assessment is a certain percentage of the fair market value that is determined by local assessors to be the total taxable value of land and additions on the property. | Land | Improvement |
|---|---|---|---|---|
| 2025 | $8,645 | $489,225 | $64,542 | $424,683 |
| 2024 | $8,645 | $479,632 | $63,276 | $416,356 |
| 2023 | $8,519 | $470,227 | $62,035 | $408,192 |
| 2022 | $8,460 | $461,007 | $60,819 | $400,188 |
| 2021 | $8,344 | $451,967 | $59,626 | $392,341 |
| 2020 | $8,219 | $447,333 | $59,015 | $388,318 |
| 2019 | $8,000 | $438,562 | $57,858 | $380,704 |
| 2018 | $8,068 | $429,963 | $56,724 | $373,239 |
| 2017 | $7,805 | $421,533 | $55,612 | $365,921 |
| 2016 | $7,605 | $413,268 | $54,522 | $358,746 |
| 2015 | $7,504 | $407,060 | $53,703 | $353,357 |
| 2014 | $7,362 | $399,086 | $52,651 | $346,435 |
Source: Public Records
Map
Nearby Homes
- 12859 Dove Wood Dr
- 6136 Walnut Grove Ct
- 6072 Blossom Place
- 0 Wardman Bullock Rd
- 13861 Laurel Tree Dr
- 14058 Pearson Ct
- 14201 Ross Ct
- 5672 San Marino Way
- 14113 Los Robles Ct
- 14138 Crescenta Way
- 13982 Claremont Ln
- 14048 Annandale Ln
- 13428 Silver Sky Rd
- 13408 Silver Sky Rd
- 5655 Lone Pine Dr
- 14552 Boots Ln
- 6602 Torrey Pine Ct
- 14080 Crestline Place
- 5498 Withers Ave
- 13751 Smokestone St
- 13835 Hummingbird Way
- 13827 Hummingbird Way
- 13839 Hummingbird Way
- 13834 Hummingbird Way
- 13830 Hummingbird Way
- 13838 Hummingbird Way
- 13838 Hummingbird Way
- 13843 Hummingbird Way
- 13801 Hummingbird Way
- 13826 Hummingbird Way
- 6032 Pine Cone Way
- 5998 Hummingbird Way
- 6042 Pine Cone Way
- 6022 Pine Cone Way
- 6052 Pine Cone Way
- 13835 Darkwood Way
- 13845 Hummingbird Way
- 6062 Pine Cone Way
- 13831 Darkwood Way
- 13822 Hummingbird Way