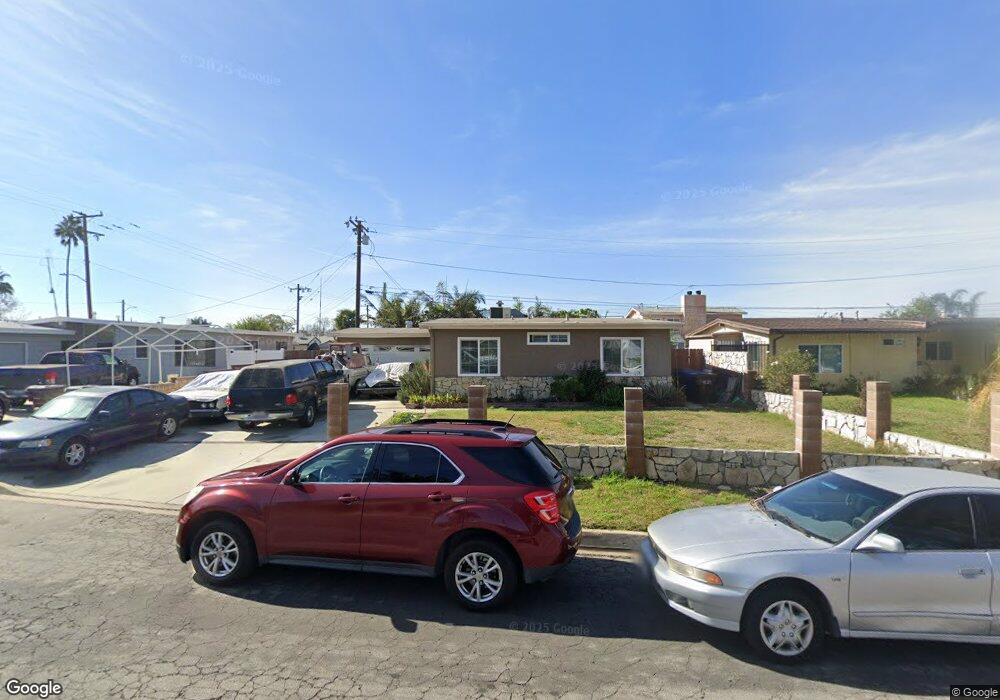
13838 Fairgrove Ave La Puente, CA 91746
West Puente Valley NeighborhoodEstimated Value: $743,000 - $866,000
3
Beds
2
Baths
1,507
Sq Ft
$534/Sq Ft
Est. Value
About This Home
This home is located at 13838 Fairgrove Ave, La Puente, CA 91746 and is currently estimated at $805,271, approximately $534 per square foot. 13838 Fairgrove Ave is a home located in Los Angeles County with nearby schools including J.E. Van Wig Elementary School, Torch Middle School, and Bassett Senior High School.
Ownership History
Date
Name
Owned For
Owner Type
Purchase Details
Closed on
Apr 22, 2005
Sold by
Trujillo Juan D and Trujillo Frances A
Bought by
Garza Roberto
Current Estimated Value
Home Financials for this Owner
Home Financials are based on the most recent Mortgage that was taken out on this home.
Original Mortgage
$328,000
Outstanding Balance
$166,397
Interest Rate
5.62%
Mortgage Type
Fannie Mae Freddie Mac
Estimated Equity
$638,874
Purchase Details
Closed on
Mar 24, 2005
Sold by
Trujillo Frances A
Bought by
Trujillo Frances A
Home Financials for this Owner
Home Financials are based on the most recent Mortgage that was taken out on this home.
Original Mortgage
$328,000
Outstanding Balance
$166,397
Interest Rate
5.62%
Mortgage Type
Fannie Mae Freddie Mac
Estimated Equity
$638,874
Purchase Details
Closed on
Jul 2, 1998
Sold by
Trujillo Juan D and Trujillo Frances A
Bought by
Trujillo Juan D and Trujillo Frances A
Create a Home Valuation Report for This Property
The Home Valuation Report is an in-depth analysis detailing your home's value as well as a comparison with similar homes in the area
Home Values in the Area
Average Home Value in this Area
Purchase History
| Date | Buyer | Sale Price | Title Company |
|---|---|---|---|
| Garza Roberto | $410,000 | North American Title Co | |
| Trujillo Frances A | -- | -- | |
| Trujillo Juan D | -- | -- |
Source: Public Records
Mortgage History
| Date | Status | Borrower | Loan Amount |
|---|---|---|---|
| Open | Garza Roberto | $328,000 | |
| Closed | Garza Roberto | $82,000 |
Source: Public Records
Tax History Compared to Growth
Tax History
| Year | Tax Paid | Tax Assessment Tax Assessment Total Assessment is a certain percentage of the fair market value that is determined by local assessors to be the total taxable value of land and additions on the property. | Land | Improvement |
|---|---|---|---|---|
| 2025 | $7,440 | $571,487 | $434,058 | $137,429 |
| 2024 | $7,440 | $560,283 | $425,548 | $134,735 |
| 2023 | $7,214 | $549,298 | $417,204 | $132,094 |
| 2022 | $6,900 | $538,528 | $409,024 | $129,504 |
| 2021 | $6,777 | $527,969 | $401,004 | $126,965 |
| 2020 | $6,743 | $522,557 | $396,893 | $125,664 |
| 2019 | $6,292 | $486,000 | $370,000 | $116,000 |
| 2018 | $6,171 | $486,000 | $370,000 | $116,000 |
| 2016 | $5,201 | $406,000 | $309,000 | $97,000 |
| 2015 | $4,724 | $370,400 | $281,600 | $88,800 |
| 2014 | $4,575 | $370,400 | $281,600 | $88,800 |
Source: Public Records
Map
Nearby Homes
- 14104 Barrydale St
- 1003 Le Borgne Ave
- 1416 Millbury Ave
- 979 Willow Ave Unit 31
- 943 Willow Ave
- 915 Stichman Ave
- 13974 Francisquito Ave Unit 8
- 1525 Bromley Ave
- 720 Le Borgne Ave
- 1718 Puente Ave Unit 40
- 1735 Puente Ave Unit 30
- 3060 Vineland Ave Unit 7
- 3004 Via Delores
- 610 Willow Ave
- 13622 Hartsville St
- 13426 Austen Way
- 13522 Francisquito Ave Unit C
- 3109 Robinette Ave
- 13120 Dart St Unit E
- 3314 Baldwin Park Blvd
- 13832 Fairgrove Ave
- 13846 Fairgrove Ave
- 13839 Rath St
- 13833 Rath St
- 13826 Fairgrove Ave
- 13847 Rath St
- 13827 Rath St
- 13839 Fairgrove Ave
- 13847 Fairgrove Ave
- 13833 Fairgrove Ave
- 13820 Fairgrove Ave
- 13827 Fairgrove Ave
- 13821 Rath St
- 13902 Fairgrove Ave
- 13821 Fairgrove Ave
- 13814 Fairgrove Ave
- 13903 Rath St
- 13838 Rath St
- 13846 Rath St
- 13838 Cagliero St