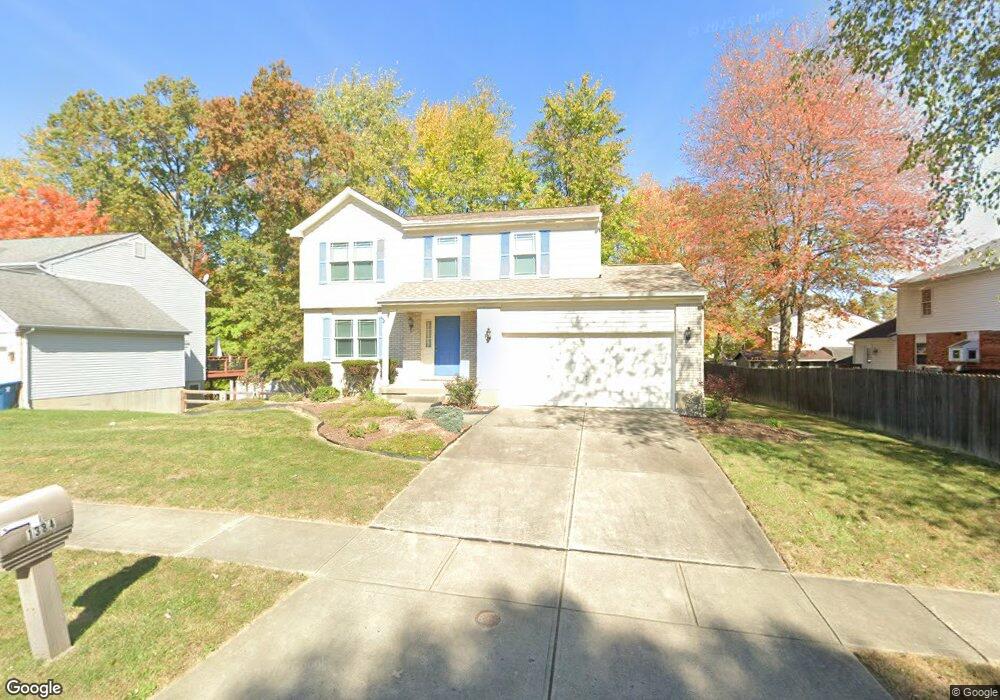
1384 Laurel Oak Amelia, OH 45102
Estimated Value: $296,369 - $335,000
3
Beds
3
Baths
1,553
Sq Ft
$208/Sq Ft
Est. Value
About This Home
This home is located at 1384 Laurel Oak, Amelia, OH 45102 and is currently estimated at $323,092, approximately $208 per square foot. 1384 Laurel Oak is a home located in Clermont County with nearby schools including Merwin Elementary School, West Clermont Middle School, and West Clermont High School.
Ownership History
Date
Name
Owned For
Owner Type
Purchase Details
Closed on
Oct 2, 2000
Sold by
Fink John E
Bought by
Booker Donna M
Current Estimated Value
Home Financials for this Owner
Home Financials are based on the most recent Mortgage that was taken out on this home.
Original Mortgage
$115,600
Outstanding Balance
$42,339
Interest Rate
7.98%
Mortgage Type
New Conventional
Estimated Equity
$280,753
Purchase Details
Closed on
May 6, 1997
Sold by
Williamsburg Properties
Bought by
Fink John E and Vickers Melissa J
Home Financials for this Owner
Home Financials are based on the most recent Mortgage that was taken out on this home.
Original Mortgage
$114,715
Interest Rate
8.05%
Mortgage Type
Balloon
Purchase Details
Closed on
Feb 27, 1995
Sold by
County Land Dev Corp
Bought by
Williamsburg Properties
Create a Home Valuation Report for This Property
The Home Valuation Report is an in-depth analysis detailing your home's value as well as a comparison with similar homes in the area
Home Values in the Area
Average Home Value in this Area
Purchase History
| Date | Buyer | Sale Price | Title Company |
|---|---|---|---|
| Booker Donna M | $144,500 | -- | |
| Fink John E | $127,715 | -- | |
| Williamsburg Properties | $37,000 | -- |
Source: Public Records
Mortgage History
| Date | Status | Borrower | Loan Amount |
|---|---|---|---|
| Open | Booker Donna M | $115,600 | |
| Previous Owner | Fink John E | $114,715 |
Source: Public Records
Tax History
| Year | Tax Paid | Tax Assessment Tax Assessment Total Assessment is a certain percentage of the fair market value that is determined by local assessors to be the total taxable value of land and additions on the property. | Land | Improvement |
|---|---|---|---|---|
| 2024 | $6,535 | $77,350 | $13,580 | $63,770 |
| 2023 | $3,618 | $77,350 | $13,580 | $63,770 |
| 2022 | $3,056 | $57,820 | $10,150 | $47,670 |
| 2021 | $3,073 | $57,820 | $10,150 | $47,670 |
| 2020 | $3,079 | $57,820 | $10,150 | $47,670 |
| 2019 | $2,514 | $52,260 | $9,910 | $42,350 |
| 2018 | $2,541 | $52,260 | $9,910 | $42,350 |
| 2017 | $2,473 | $52,260 | $9,910 | $42,350 |
| 2016 | $2,473 | $46,240 | $8,750 | $37,490 |
| 2015 | $2,350 | $46,240 | $8,750 | $37,490 |
| 2014 | $2,350 | $46,240 | $8,750 | $37,490 |
| 2013 | $2,236 | $43,330 | $9,100 | $34,230 |
Source: Public Records
Map
Nearby Homes
- 1342 Covedale Ln
- 1328 Hammann Dr
- 1335 Lakefront Ct
- 3826 Golden Meadow Ct
- 3840 Bach Grove Ct
- 3821 Golden Meadow Ct
- 4 Gumbert Dr
- 360 Amelia Olive Branch Rd
- 3735 Maplebrooke Ln
- 1205 Buxton Oaks Dr
- 1204 Buxton Oaks Dr
- 3733 Maplebrooke Ln
- Tallmadge Plan at
- Portsmouth Plan at
- 1190 Twin Gate Run
- 3664 Lewis Rd
- 3858 Heritage Oaks Dr
- 3826 Portrush Way
- Wembley Plan at Olivewood Park - Paired Patio Collection
- 1061 Olivewood Ave
- 1386 Laurel Oak
- 1379 Gumbert Dr
- 3800 Grey Birch
- 1375 Gumbert Dr
- 1388 Laurel Oak
- 1385 Laurel Oak
- 1381 Gumbert Dr
- 3802 Grey Birch
- 1378 Gumbert Dr
- 1376 Gumbert Dr
- 1380 Gumbert Dr
- 1383 Gumbert Dr
- 1374 Gumbert Dr
- 1387 Laurel Oak
- 1280 Avian Way
- 3804 Grey Birch
- 3795 Grey Birch
- 1382 Gumbert Dr
- 3797 Grey Birch
- 1385 Gumbert Dr
Your Personal Tour Guide
Ask me questions while you tour the home.