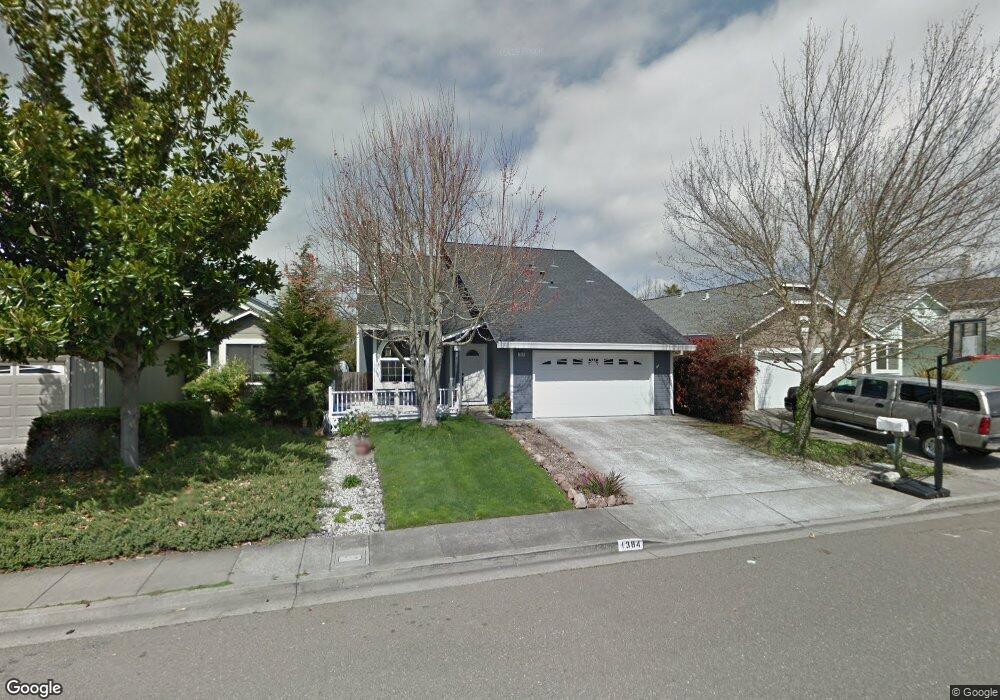
1384 Miramonte Place Rohnert Park, CA 94928
Estimated Value: $732,000 - $812,000
4
Beds
3
Baths
1,821
Sq Ft
$430/Sq Ft
Est. Value
About This Home
This home is located at 1384 Miramonte Place, Rohnert Park, CA 94928 and is currently estimated at $783,698, approximately $430 per square foot. 1384 Miramonte Place is a home located in Sonoma County with nearby schools including Rancho Cotate High School, Credo High School, and Cross & Crown Lutheran School.
Ownership History
Date
Name
Owned For
Owner Type
Purchase Details
Closed on
Dec 31, 2015
Sold by
Traverso Dennis J and Traverso Sherrill
Bought by
The Dennis J Traverso & Sherrill L Trave
Current Estimated Value
Home Financials for this Owner
Home Financials are based on the most recent Mortgage that was taken out on this home.
Original Mortgage
$272,000
Outstanding Balance
$115,398
Interest Rate
3.92%
Mortgage Type
New Conventional
Estimated Equity
$668,301
Purchase Details
Closed on
Dec 6, 2010
Sold by
Traverso Dennis J and Traverso Sherrill L
Bought by
Traverso Dennis J and Traverso Sherrill L
Purchase Details
Closed on
Oct 27, 1988
Bought by
Traverso Dennis J Tr & Traverso Sherrill L Tr
Create a Home Valuation Report for This Property
The Home Valuation Report is an in-depth analysis detailing your home's value as well as a comparison with similar homes in the area
Home Values in the Area
Average Home Value in this Area
Purchase History
| Date | Buyer | Sale Price | Title Company |
|---|---|---|---|
| The Dennis J Traverso & Sherrill L Trave | -- | Fidelity National Title Co | |
| Traverso Dennis J | -- | Fidelity National Title Co | |
| Traverso Dennis J | -- | None Available | |
| Traverso Dennis J Tr & Traverso Sherrill L Tr | $138,000 | -- |
Source: Public Records
Mortgage History
| Date | Status | Borrower | Loan Amount |
|---|---|---|---|
| Open | Traverso Dennis J | $272,000 |
Source: Public Records
Tax History Compared to Growth
Tax History
| Year | Tax Paid | Tax Assessment Tax Assessment Total Assessment is a certain percentage of the fair market value that is determined by local assessors to be the total taxable value of land and additions on the property. | Land | Improvement |
|---|---|---|---|---|
| 2025 | $2,943 | $258,018 | $84,437 | $173,581 |
| 2024 | $2,943 | $252,960 | $82,782 | $170,178 |
| 2023 | $2,943 | $248,001 | $81,159 | $166,842 |
| 2022 | $2,882 | $243,139 | $79,568 | $163,571 |
| 2021 | $2,857 | $238,372 | $78,008 | $160,364 |
| 2020 | $2,897 | $235,929 | $77,209 | $158,720 |
| 2019 | $2,858 | $231,304 | $75,696 | $155,608 |
| 2018 | $2,802 | $226,769 | $74,212 | $152,557 |
| 2017 | $2,754 | $222,323 | $72,757 | $149,566 |
| 2016 | $2,636 | $217,965 | $71,331 | $146,634 |
| 2015 | $2,571 | $214,692 | $70,260 | $144,432 |
| 2014 | $2,551 | $210,487 | $68,884 | $141,603 |
Source: Public Records
Map
Nearby Homes
- 7645 Camino Colegio
- 7767 Camino Colegio Unit 29
- 8201 Camino Colegio Unit 221
- 8201 Camino Colegio Unit 122
- 8201 Camino Colegio Unit 11
- 8201 Camino Colegio Unit 120
- 8201 Camino Colegio Unit 17
- 8201 Camino Colegio Unit 158
- 8006 Manor Ct
- 1214 Marque Dr
- 1217 Mateo Dr
- 7006 Santero Way
- 9005 Camino Colegio
- 1252 Waldorf Ln
- 9013 Camino Colegio
- 9017 Camino Colegio
- 9021 Camino Colegio
- 9029 Camino Colegio
- 9037 Camino Colegio
- 1328 Waldorf Ln
- 1388 Miramonte Place
- 1380 Miramonte Place
- 1392 Miramonte Place
- 1376 Miramonte Place
- 7744 Montero Dr
- 7740 Montero Dr
- 7748 Montero Dr
- 1372 Miramonte Place
- 7752 Montero Dr
- 7736 Montero Dr
- 1396 Miramonte Place
- 1383 Miramonte Place
- 1387 Miramonte Place
- 1379 Miramonte Place
- 7756 Montero Dr
- 7732 Montero Dr
- 1391 Miramonte Place
- 1375 Miramonte Place
- 1368 Miramonte Place
- 1395 Miramonte Place