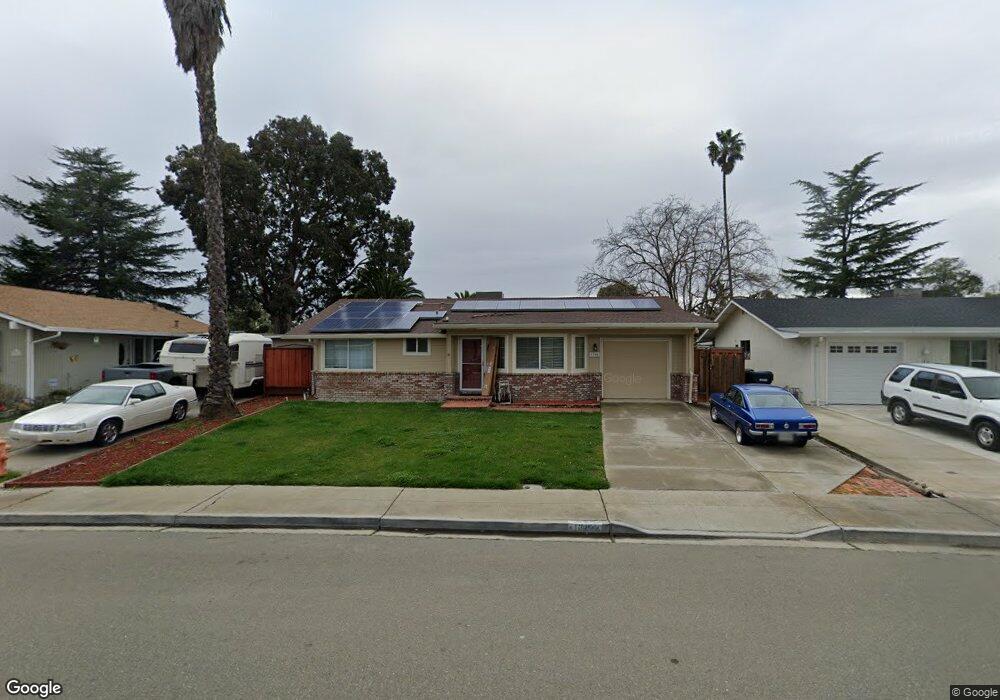
1384 Tulip Way Livermore, CA 94551
Springtown NeighborhoodEstimated Value: $1,038,000 - $1,102,000
3
Beds
2
Baths
1,717
Sq Ft
$619/Sq Ft
Est. Value
About This Home
This home is located at 1384 Tulip Way, Livermore, CA 94551 and is currently estimated at $1,063,605, approximately $619 per square foot. 1384 Tulip Way is a home located in Alameda County with nearby schools including Altamont Creek Elementary School, Andrew N. Christensen Middle School, and Livermore High School.
Ownership History
Date
Name
Owned For
Owner Type
Purchase Details
Closed on
Oct 7, 2013
Sold by
Sturgill Kenneth W and Sturgill Tammy A
Bought by
Santiago James and Santiago Katie C
Current Estimated Value
Home Financials for this Owner
Home Financials are based on the most recent Mortgage that was taken out on this home.
Original Mortgage
$561,825
Outstanding Balance
$422,987
Interest Rate
4.55%
Mortgage Type
VA
Estimated Equity
$640,618
Purchase Details
Closed on
Feb 1, 1999
Sold by
Dunlop David M and Dunlop Janet S
Bought by
Sturgill Kenneth W and Sturgill Tammy A
Home Financials for this Owner
Home Financials are based on the most recent Mortgage that was taken out on this home.
Original Mortgage
$183,950
Interest Rate
6.73%
Create a Home Valuation Report for This Property
The Home Valuation Report is an in-depth analysis detailing your home's value as well as a comparison with similar homes in the area
Home Values in the Area
Average Home Value in this Area
Purchase History
| Date | Buyer | Sale Price | Title Company |
|---|---|---|---|
| Santiago James | $562,000 | Chicago Title Company | |
| Sturgill Kenneth W | $230,000 | Financial Title Company |
Source: Public Records
Mortgage History
| Date | Status | Borrower | Loan Amount |
|---|---|---|---|
| Open | Santiago James | $561,825 | |
| Previous Owner | Sturgill Kenneth W | $183,950 | |
| Closed | Sturgill Kenneth W | $22,900 |
Source: Public Records
Tax History Compared to Growth
Tax History
| Year | Tax Paid | Tax Assessment Tax Assessment Total Assessment is a certain percentage of the fair market value that is determined by local assessors to be the total taxable value of land and additions on the property. | Land | Improvement |
|---|---|---|---|---|
| 2025 | $8,569 | $667,194 | $202,258 | $471,936 |
| 2024 | $8,569 | $653,978 | $198,293 | $462,685 |
| 2023 | $8,440 | $648,020 | $194,406 | $453,614 |
| 2022 | $8,318 | $628,315 | $190,594 | $444,721 |
| 2021 | $8,148 | $615,863 | $186,859 | $436,004 |
| 2020 | $7,911 | $616,477 | $184,943 | $431,534 |
| 2019 | $7,943 | $604,394 | $181,318 | $423,076 |
| 2018 | $7,773 | $592,547 | $177,764 | $414,783 |
| 2017 | $7,573 | $580,931 | $174,279 | $406,652 |
| 2016 | $7,294 | $569,541 | $170,862 | $398,679 |
| 2015 | $6,859 | $560,988 | $168,296 | $392,692 |
| 2014 | $6,801 | $550,000 | $165,000 | $385,000 |
Source: Public Records
Map
Nearby Homes
- 5179 Crocus Way
- 1241 Hibiscus Way
- 1333 Daisy Ln
- 1370 Daisy Ln
- 4831 Zinnia Ct
- 1304 Heather Ln
- 1688 Bluebell Dr
- 1806 Bluebell Dr
- 814 Sundial Cir Unit 105
- 1464 Columbine Way
- 1031 Spring Valley Common
- 734 Bellflower St
- 1479 Spring Valley Common
- 5182 Sunburst Ln
- 5473 Rainflower Dr
- 1981 Monterey Dr
- 2035 Monterey Dr
- 2013 Galloway Common
- 5801 Flora Common
- 2135 Bluebell Dr
- 1416 Tulip Way
- 1372 Tulip Way
- 1271 Hollyhock St
- 1307 Hollyhock St
- 1422 Tulip Way
- 1263 Hollyhock St
- 1360 Tulip Way
- 1321 Hollyhock St
- 1249 Hollyhock St
- 1377 Tulip Way
- 1430 Tulip Way
- 1415 Tulip Way
- 1348 Tulip Way
- 1363 Tulip Way
- 1335 Hollyhock St
- 1237 Hollyhock St
- 1429 Tulip Way
- 1355 Tulip Way
- 1357 Hollyhock St
- 1336 Tulip Way