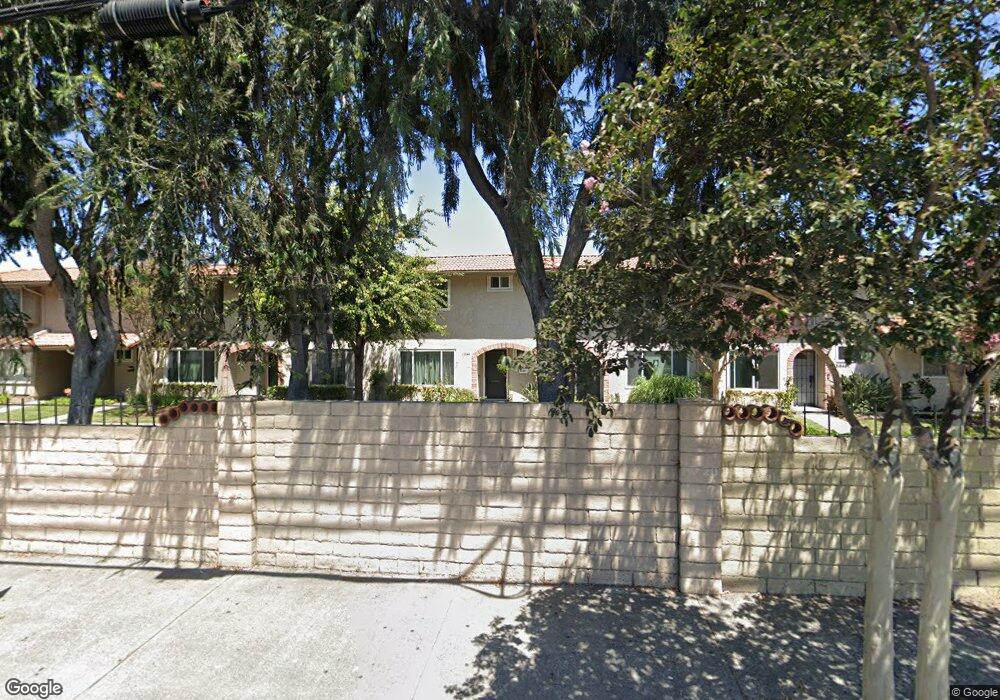
13844 La Jolla Plaza Garden Grove, CA 92844
Estimated Value: $815,000 - $907,000
3
Beds
3
Baths
1,637
Sq Ft
$532/Sq Ft
Est. Value
About This Home
This home is located at 13844 La Jolla Plaza, Garden Grove, CA 92844 and is currently estimated at $870,272, approximately $531 per square foot. 13844 La Jolla Plaza is a home located in Orange County with nearby schools including Cook Elementary School, Donald S. Jordan Intermediate School, and Bolsa Grande High School.
Ownership History
Date
Name
Owned For
Owner Type
Purchase Details
Closed on
Apr 1, 2021
Sold by
Gerges Soheir A
Bought by
Gerges Soheir A and Nairooz Fayez I
Current Estimated Value
Home Financials for this Owner
Home Financials are based on the most recent Mortgage that was taken out on this home.
Original Mortgage
$163,000
Outstanding Balance
$147,404
Interest Rate
3.1%
Mortgage Type
New Conventional
Estimated Equity
$722,868
Purchase Details
Closed on
Feb 5, 2004
Sold by
Nairooz Fayez I and Gerges Soheir A
Bought by
Nairooz Fayez I and Gerges Soheir A
Purchase Details
Closed on
Dec 13, 2001
Sold by
Lalonde Tom
Bought by
Nairooz Fayez I and Gerges Soheir A
Home Financials for this Owner
Home Financials are based on the most recent Mortgage that was taken out on this home.
Original Mortgage
$209,039
Interest Rate
7.01%
Mortgage Type
FHA
Create a Home Valuation Report for This Property
The Home Valuation Report is an in-depth analysis detailing your home's value as well as a comparison with similar homes in the area
Home Values in the Area
Average Home Value in this Area
Purchase History
| Date | Buyer | Sale Price | Title Company |
|---|---|---|---|
| Gerges Soheir A | -- | Orange Coast Title | |
| Gerges Soheir A | -- | Orange Coast Title | |
| Nairooz Fayez I | -- | -- | |
| Nairooz Fayez I | $212,000 | Lawyers Title Company |
Source: Public Records
Mortgage History
| Date | Status | Borrower | Loan Amount |
|---|---|---|---|
| Open | Gerges Soheir A | $163,000 | |
| Closed | Nairooz Fayez I | $209,039 | |
| Closed | Nairooz Fayez I | $6,360 |
Source: Public Records
Tax History Compared to Growth
Tax History
| Year | Tax Paid | Tax Assessment Tax Assessment Total Assessment is a certain percentage of the fair market value that is determined by local assessors to be the total taxable value of land and additions on the property. | Land | Improvement |
|---|---|---|---|---|
| 2025 | $3,952 | $313,030 | $178,077 | $134,953 |
| 2024 | $3,952 | $306,893 | $174,586 | $132,307 |
| 2023 | $3,875 | $300,876 | $171,163 | $129,713 |
| 2022 | $3,790 | $294,977 | $167,807 | $127,170 |
| 2021 | $3,749 | $289,194 | $164,517 | $124,677 |
| 2020 | $3,699 | $286,229 | $162,830 | $123,399 |
| 2019 | $3,629 | $280,617 | $159,637 | $120,980 |
| 2018 | $3,556 | $275,115 | $156,507 | $118,608 |
| 2017 | $3,506 | $269,721 | $153,438 | $116,283 |
| 2016 | $3,336 | $264,433 | $150,430 | $114,003 |
| 2015 | $3,289 | $260,461 | $148,170 | $112,291 |
| 2014 | $3,208 | $255,359 | $145,267 | $110,092 |
Source: Public Records
Map
Nearby Homes
- 10061 15th St
- 9906 13th St
- 14171 Flower St
- 9884 11th St
- 14362 Bushard St Unit 39
- 14362 Bushard St Unit 109
- 9200 Westminster Blvd Unit 25
- 13262 Verde St
- 9141 Jennrich Ave
- 10002 Central Ave Unit 26
- 10002 Central Ave Unit 27
- 10002 Central Ave
- 10002 Central Ave Unit 25
- 9691 Central Ave
- 9931 Central Ave
- 14151 Lake St
- 9651 Crosby Ave
- 13839 Magnolia St
- 13711 Magnolia St
- 8866 Grandville Cir
- 13845 La Jolla Plaza
- 13846 La Jolla Plaza
- 13847 La Jolla Plaza
- 13843 La Jolla Plaza
- 13842 La Jolla Plaza
- 13841 La Jolla Plaza
- 13853 La Jolla Plaza
- 13852 La Jolla Plaza
- 13854 La Jolla Plaza
- 13840 La Jolla Plaza
- 13855 La Jolla Plaza
- 13851 La Jolla Plaza
- 13856 La Jolla Plaza
- 13857 La Jolla Plaza
- 13858 La Jolla Plaza
- 13839 La Jolla Plaza
- 13838 La Jolla Plaza
- 13837 La Jolla Plaza
- 13836 La Jolla Plaza
- 13859 La Jolla Plaza