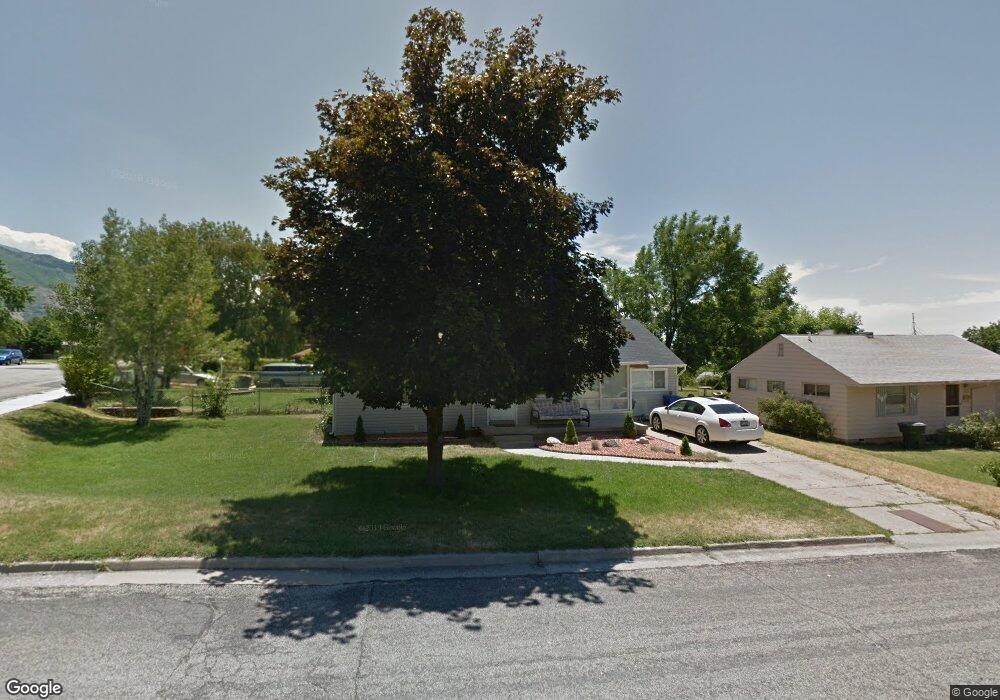
1385 Hudson St Ogden, UT 84404
Horace Mann NeighborhoodEstimated Value: $349,000 - $388,000
3
Beds
1
Bath
1,189
Sq Ft
$303/Sq Ft
Est. Value
About This Home
This home is located at 1385 Hudson St, Ogden, UT 84404 and is currently estimated at $360,107, approximately $302 per square foot. 1385 Hudson St is a home located in Weber County with nearby schools including Mound Fort Junior High School and Ben Lomond High School.
Ownership History
Date
Name
Owned For
Owner Type
Purchase Details
Closed on
Jun 26, 2013
Sold by
Glines Stephen
Bought by
Glines Properties 1 Llc
Current Estimated Value
Purchase Details
Closed on
Jul 11, 2008
Sold by
Ririe Stephen
Bought by
Glines Stephen
Home Financials for this Owner
Home Financials are based on the most recent Mortgage that was taken out on this home.
Original Mortgage
$90,400
Outstanding Balance
$58,231
Interest Rate
6.04%
Mortgage Type
Seller Take Back
Estimated Equity
$301,876
Purchase Details
Closed on
Apr 26, 2004
Sold by
Ririe Stephen D and Ririe Stephen
Bought by
Ririe Stephen
Home Financials for this Owner
Home Financials are based on the most recent Mortgage that was taken out on this home.
Original Mortgage
$50,000
Interest Rate
6.62%
Mortgage Type
New Conventional
Purchase Details
Closed on
Apr 20, 1998
Sold by
Ririe Stephen D and Ririe Jolene B
Bought by
Ririe Stephen D
Home Financials for this Owner
Home Financials are based on the most recent Mortgage that was taken out on this home.
Original Mortgage
$66,500
Interest Rate
7.15%
Create a Home Valuation Report for This Property
The Home Valuation Report is an in-depth analysis detailing your home's value as well as a comparison with similar homes in the area
Home Values in the Area
Average Home Value in this Area
Purchase History
| Date | Buyer | Sale Price | Title Company |
|---|---|---|---|
| Glines Properties 1 Llc | -- | None Available | |
| Glines Stephen | -- | First American Bountiful | |
| Ririe Stephen | -- | Executive Title | |
| Ririe Stephen D | -- | First American Title |
Source: Public Records
Mortgage History
| Date | Status | Borrower | Loan Amount |
|---|---|---|---|
| Open | Glines Stephen | $90,400 | |
| Previous Owner | Ririe Stephen | $50,000 | |
| Previous Owner | Ririe Stephen D | $66,500 |
Source: Public Records
Tax History Compared to Growth
Tax History
| Year | Tax Paid | Tax Assessment Tax Assessment Total Assessment is a certain percentage of the fair market value that is determined by local assessors to be the total taxable value of land and additions on the property. | Land | Improvement |
|---|---|---|---|---|
| 2025 | $2,329 | $310,472 | $118,729 | $191,743 |
| 2024 | $2,329 | $304,000 | $118,741 | $185,259 |
| 2023 | $2,227 | $294,000 | $109,078 | $184,922 |
| 2022 | $2,412 | $324,000 | $94,288 | $229,712 |
| 2021 | $1,890 | $227,000 | $47,378 | $179,622 |
| 2020 | $1,831 | $203,000 | $39,447 | $163,553 |
| 2019 | $1,757 | $182,000 | $34,432 | $147,568 |
| 2018 | $1,493 | $151,000 | $29,546 | $121,454 |
| 2017 | $1,303 | $121,000 | $25,550 | $95,450 |
| 2016 | $1,113 | $54,681 | $15,640 | $39,041 |
| 2015 | $990 | $47,406 | $15,640 | $31,766 |
| 2014 | $924 | $43,271 | $15,640 | $27,631 |
Source: Public Records
Map
Nearby Homes
- 446 Robins Ave
- 3270 N 3325 W Unit 386B
- 462 Hiland Rd
- 1274 5th St
- 1243 Hudson St
- 1302 Harrop St
- 727 Robins Ave
- 1568 Hudson St Unit 1
- 3088 N 3075 W
- 777 Simoron Dr
- 1363 Lewis Dr
- 724 Hislop Dr
- 1427 Sheridan Dr
- 915 Hislop Dr
- 131 Taylor Ave
- 261 Van Buren Ave
- 1120 Cross St
- 1272 Earl Dr
- 1410 12th St
- 1034 1st St