13850 La Jolla Plaza Garden Grove, CA 92844
Estimated Value: $785,866 - $970,000
3
Beds
3
Baths
1,637
Sq Ft
$523/Sq Ft
Est. Value
About This Home
This home is located at 13850 La Jolla Plaza, Garden Grove, CA 92844 and is currently estimated at $856,967, approximately $523 per square foot. 13850 La Jolla Plaza is a home located in Orange County with nearby schools including Cook Elementary School, Donald S. Jordan Intermediate School, and Bolsa Grande High School.
Ownership History
Date
Name
Owned For
Owner Type
Purchase Details
Closed on
Jun 5, 2006
Sold by
Wein Robert
Bought by
Lee Lisa and Lee Eileen
Current Estimated Value
Home Financials for this Owner
Home Financials are based on the most recent Mortgage that was taken out on this home.
Original Mortgage
$75,000
Interest Rate
6.66%
Mortgage Type
Purchase Money Mortgage
Purchase Details
Closed on
May 25, 2006
Sold by
Lerino Louis Frank and Lerino Fiapaipai
Bought by
Wein Robert
Home Financials for this Owner
Home Financials are based on the most recent Mortgage that was taken out on this home.
Original Mortgage
$75,000
Interest Rate
6.66%
Mortgage Type
Purchase Money Mortgage
Purchase Details
Closed on
Mar 24, 1995
Sold by
Teresa Valerie Ann
Bought by
Ierino Louis Frank and Ierino Fiapaipai
Home Financials for this Owner
Home Financials are based on the most recent Mortgage that was taken out on this home.
Original Mortgage
$122,400
Interest Rate
8.46%
Mortgage Type
Assumption
Create a Home Valuation Report for This Property
The Home Valuation Report is an in-depth analysis detailing your home's value as well as a comparison with similar homes in the area
Home Values in the Area
Average Home Value in this Area
Purchase History
| Date | Buyer | Sale Price | Title Company |
|---|---|---|---|
| Lee Lisa | $479,000 | Lawyers Title | |
| Wein Robert | -- | Lawyers Title Ins | |
| Ierino Louis Frank | $120,000 | Gateway Title Company |
Source: Public Records
Mortgage History
| Date | Status | Borrower | Loan Amount |
|---|---|---|---|
| Closed | Lee Lisa | $75,000 | |
| Previous Owner | Ierino Louis Frank | $122,400 |
Source: Public Records
Tax History Compared to Growth
Tax History
| Year | Tax Paid | Tax Assessment Tax Assessment Total Assessment is a certain percentage of the fair market value that is determined by local assessors to be the total taxable value of land and additions on the property. | Land | Improvement |
|---|---|---|---|---|
| 2025 | $7,826 | $641,751 | $463,698 | $178,053 |
| 2024 | $7,826 | $629,168 | $454,606 | $174,562 |
| 2023 | $6,584 | $530,604 | $389,567 | $141,037 |
| 2022 | $6,443 | $520,200 | $381,928 | $138,272 |
| 2021 | $6,374 | $510,000 | $374,439 | $135,561 |
| 2020 | $6,433 | $510,000 | $374,439 | $135,561 |
| 2019 | $6,309 | $500,000 | $367,097 | $132,903 |
| 2018 | $5,920 | $468,000 | $335,097 | $132,903 |
| 2017 | $5,401 | $422,000 | $289,097 | $132,903 |
| 2016 | $4,941 | $397,000 | $264,097 | $132,903 |
| 2015 | $4,641 | $371,000 | $238,097 | $132,903 |
| 2014 | $4,266 | $340,710 | $207,807 | $132,903 |
Source: Public Records
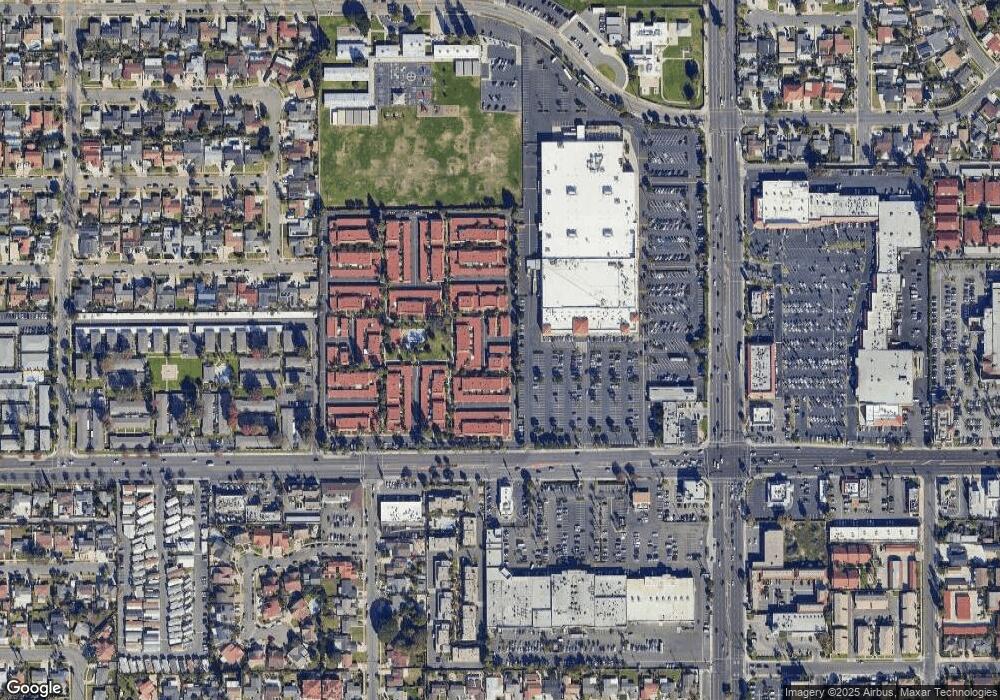
Map
Nearby Homes
- 10061 15th St
- 14171 Flower St
- 9906 13th St
- 9884 11th St
- 14362 Bushard St Unit 39
- 14362 Bushard St Unit 109
- 13262 Verde St
- 9200 Westminster Blvd Unit 25
- 10002 Central Ave Unit 26
- 10002 Central Ave Unit 27
- 10002 Central Ave
- 10002 Central Ave Unit 25
- 9691 Central Ave
- 9931 Central Ave
- 14151 Lake St
- 9141 Jennrich Ave
- 9651 Crosby Ave
- 13839 Magnolia St
- 13161 Adland St
- 13372 Jessica Dr
- 13849 La Jolla Plaza
- 13848 La Jolla Plaza
- 13861 La Jolla Plaza
- 13860 La Jolla Plaza
- 13859 La Jolla Plaza
- 13862 La Jolla Plaza
- 13866 La Jolla Plaza
- 13863 La Jolla Plaza
- 13853 La Jolla Plaza
- 13854 La Jolla Plaza
- 13852 La Jolla Plaza
- 13851 La Jolla Plaza
- 13867 La Jolla Plaza
- 13864 La Jolla Plaza
- 13855 La Jolla Plaza
- 13856 La Jolla Plaza
- 13865 La Jolla Plaza
- 13857 La Jolla Plaza
- 13858 La Jolla Plaza
- 13831 La Jolla Plaza