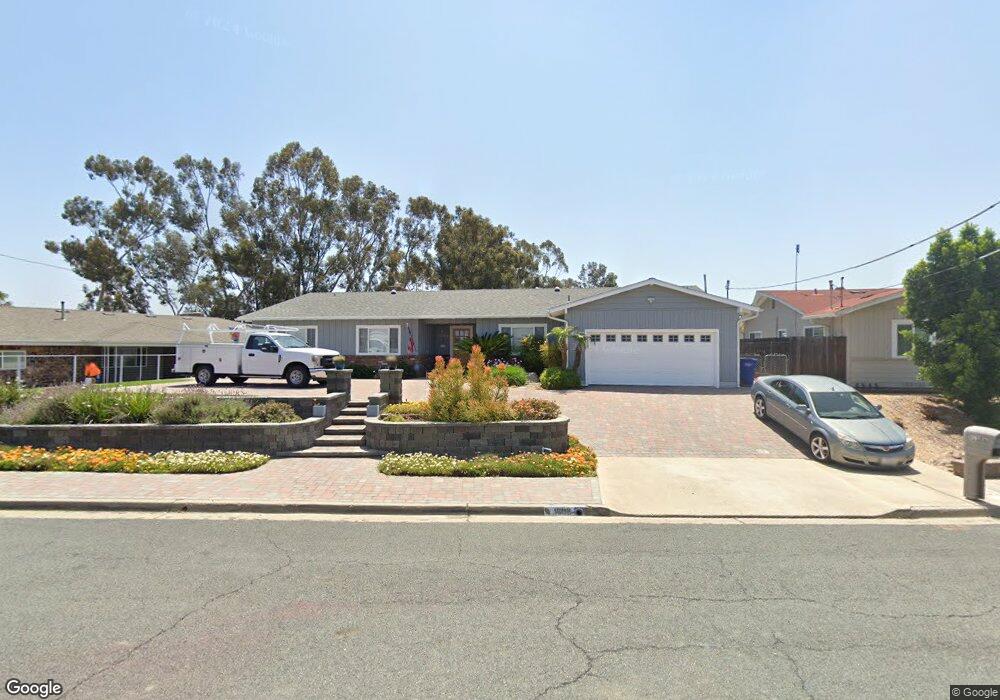
1386 Hillside Way El Cajon, CA 92020
Fletcher Hills NeighborhoodEstimated Value: $935,000 - $1,221,000
5
Beds
2
Baths
2,262
Sq Ft
$471/Sq Ft
Est. Value
About This Home
This home is located at 1386 Hillside Way, El Cajon, CA 92020 and is currently estimated at $1,065,565, approximately $471 per square foot. 1386 Hillside Way is a home located in San Diego County with nearby schools including Northmont Elementary School, Parkway Academy, and Grossmont High School.
Ownership History
Date
Name
Owned For
Owner Type
Purchase Details
Closed on
Dec 21, 2006
Sold by
Stutz Steven M and Stutz Margherita
Bought by
Stutz Steven M and Stutz Margherita
Current Estimated Value
Purchase Details
Closed on
Feb 10, 2000
Sold by
Ljk Realty I
Bought by
Stutz Steven M and Stutz Margherita
Home Financials for this Owner
Home Financials are based on the most recent Mortgage that was taken out on this home.
Original Mortgage
$220,000
Outstanding Balance
$73,257
Interest Rate
8.26%
Estimated Equity
$992,308
Purchase Details
Closed on
Oct 24, 1994
Sold by
Kendall Willis Lloyd and Kendall Joanna May
Bought by
Ljk Realty I
Purchase Details
Closed on
Sep 13, 1993
Sold by
Kendall Willis L and Kendall Joanna M
Bought by
Kendall Willis L and Kendall Joanna M
Purchase Details
Closed on
Apr 29, 1986
Create a Home Valuation Report for This Property
The Home Valuation Report is an in-depth analysis detailing your home's value as well as a comparison with similar homes in the area
Home Values in the Area
Average Home Value in this Area
Purchase History
| Date | Buyer | Sale Price | Title Company |
|---|---|---|---|
| Stutz Steven M | -- | None Available | |
| Stutz Steven M | -- | None Available | |
| Stutz Steven M | $306,000 | Chicago Title Co | |
| Ljk Realty I | -- | -- | |
| Kendall Willis L | -- | -- | |
| -- | $128,000 | -- |
Source: Public Records
Mortgage History
| Date | Status | Borrower | Loan Amount |
|---|---|---|---|
| Open | Stutz Steven M | $220,000 |
Source: Public Records
Tax History Compared to Growth
Tax History
| Year | Tax Paid | Tax Assessment Tax Assessment Total Assessment is a certain percentage of the fair market value that is determined by local assessors to be the total taxable value of land and additions on the property. | Land | Improvement |
|---|---|---|---|---|
| 2025 | $6,378 | $470,291 | $144,698 | $325,593 |
| 2024 | $6,378 | $461,070 | $141,861 | $319,209 |
| 2023 | $6,223 | $452,030 | $139,080 | $312,950 |
| 2022 | $6,094 | $443,167 | $136,353 | $306,814 |
| 2021 | $5,912 | $434,479 | $133,680 | $300,799 |
| 2020 | $5,577 | $430,025 | $132,310 | $297,715 |
| 2019 | $4,841 | $421,594 | $129,716 | $291,878 |
| 2018 | $4,739 | $413,328 | $127,173 | $286,155 |
| 2017 | $4,670 | $405,225 | $124,680 | $280,545 |
| 2016 | $4,516 | $397,281 | $122,236 | $275,045 |
| 2015 | $4,484 | $391,314 | $120,400 | $270,914 |
| 2014 | $4,393 | $383,650 | $118,042 | $265,608 |
Source: Public Records
Map
Nearby Homes
- 302 Travelodge Dr
- 364 Travelodge Dr
- 578 Millar Ave
- 274 S Pierce St Unit 17
- 168 S Pierce St
- 1280 W Main St Unit 24
- 1280 W Main St Unit 6
- 538 S Johnson Ave
- 275 Hihill Way
- 306 Richardson Ave Unit 10
- 649 W Washington Ave
- 927 W Main St
- 1365 Pine Dr
- 1498 Berenda Place
- 1198 Benjamin Place
- 6110 Amaya Dr
- 370 Gateway Dr
- Plan 1448 Modeled at Gateway
- Plan 1709 Modeled at Gateway
- 511 Cobblestone Ct
- 1390 Hillside Way
- 659 Murray Dr
- 1380 Hillside Way
- 667 Murray Dr
- 1377 Hillside Way
- 1370 Hillside Way
- 1395 Hillside Way
- 1383 Hillside Way
- 649 Murray Dr
- 675 Murray Dr
- 641 Murray Dr
- 658 Murray Dr
- 637 Travelodge Dr
- 666 Murray Dr
- 683 Murray Dr
- 650 Murray Dr
- 677 La Sombra Dr
- 676 Murray Dr
- 635 Murray Dr
- 631 Travelodge Dr