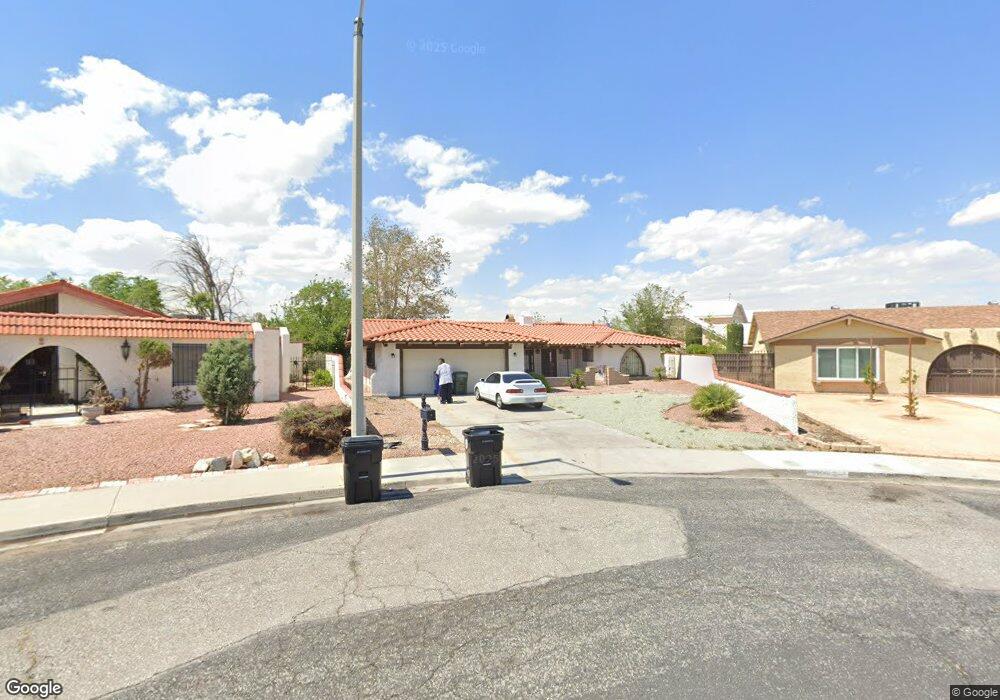
13860 Dahlgren Dr Victorville, CA 92395
Estimated Value: $395,000 - $422,000
3
Beds
2
Baths
1,756
Sq Ft
$236/Sq Ft
Est. Value
About This Home
This home is located at 13860 Dahlgren Dr, Victorville, CA 92395 and is currently estimated at $414,359, approximately $235 per square foot. 13860 Dahlgren Dr is a home located in San Bernardino County with nearby schools including Green Tree East Elementary School, Del Rey Elementary School, and Lakeview Leadership Academy.
Ownership History
Date
Name
Owned For
Owner Type
Purchase Details
Closed on
Apr 25, 2024
Sold by
Nowakoski Gabriele Sylvia
Bought by
Ramirez Aram and Ramirez Norma
Current Estimated Value
Home Financials for this Owner
Home Financials are based on the most recent Mortgage that was taken out on this home.
Original Mortgage
$348,570
Outstanding Balance
$343,883
Interest Rate
7.1%
Mortgage Type
FHA
Estimated Equity
$70,476
Purchase Details
Closed on
Aug 2, 1993
Sold by
Branson Edie
Bought by
Nowakowski Francis H and Nowakowski Gabriele S
Home Financials for this Owner
Home Financials are based on the most recent Mortgage that was taken out on this home.
Original Mortgage
$124,000
Interest Rate
6.95%
Create a Home Valuation Report for This Property
The Home Valuation Report is an in-depth analysis detailing your home's value as well as a comparison with similar homes in the area
Home Values in the Area
Average Home Value in this Area
Purchase History
| Date | Buyer | Sale Price | Title Company |
|---|---|---|---|
| Ramirez Aram | $355,000 | Fidelity National Title Compan | |
| Nowakowski Francis H | $155,000 | First American Title Insuran |
Source: Public Records
Mortgage History
| Date | Status | Borrower | Loan Amount |
|---|---|---|---|
| Open | Ramirez Aram | $348,570 | |
| Previous Owner | Nowakowski Francis H | $124,000 |
Source: Public Records
Tax History Compared to Growth
Tax History
| Year | Tax Paid | Tax Assessment Tax Assessment Total Assessment is a certain percentage of the fair market value that is determined by local assessors to be the total taxable value of land and additions on the property. | Land | Improvement |
|---|---|---|---|---|
| 2025 | $3,035 | $362,100 | $72,420 | $289,680 |
| 2024 | $3,035 | $258,279 | $63,320 | $194,959 |
| 2023 | $3,004 | $253,214 | $62,078 | $191,136 |
| 2022 | $2,952 | $248,249 | $60,861 | $187,388 |
| 2021 | $2,897 | $243,382 | $59,668 | $183,714 |
| 2020 | $2,845 | $240,886 | $59,056 | $181,830 |
| 2019 | $2,797 | $236,163 | $57,898 | $178,265 |
| 2018 | $2,977 | $231,533 | $56,763 | $174,770 |
| 2017 | $2,914 | $226,993 | $55,650 | $171,343 |
| 2016 | $2,854 | $222,542 | $54,559 | $167,983 |
| 2015 | $2,750 | $219,199 | $53,739 | $165,460 |
| 2014 | $2,698 | $214,905 | $52,686 | $162,219 |
Source: Public Records
Map
Nearby Homes
- 13951 Burning Tree Dr
- 0 Wimbleton Dr
- 16272 Trinidad Dr
- 13958 Burning Tree Dr
- 13997 Wimbleton Dr
- 14035 Wimbleton Dr
- 13829 Riviera Dr
- 13671 Westwood Dr
- 13925 Burning Tree Dr
- 13916 Burning Tree Dr
- 13717 Oakmont Dr
- 16253 Pebble Beach Dr
- 16340 Camelback Dr
- 16321 Pebble Beach
- 13991 Riviera Dr
- 14166 Riviera Dr
- 14 Arrowhead Dr
- 14172 La Paz Dr
- 13964 Victoria Ct
- 14005 Victoria Dr
- 13860 Dahlgren Dr Unit A
- 13860 Dahlgren Dr
- 13870 Dahlgren Dr
- 13876 Quail Creek Place
- 13880 Dahlgren Dr
- 13834 Dahlgren Dr
- 13874 Quail Creek Place
- 13878 Quail Creek Place
- 13837 Dahlgren Dr
- 13852 Arrowhead Dr
- 13824 Dahlgren Dr
- 13872 Quail Creek Place
- 13827 Dahlgren Dr
- 13891 Dahlgren Dr
- 13822 Arrowhead Dr
- 13820 Dahlgren Dr
- 13817 Dahlgren Dr
- 13884 Quail Creek Place
- 13853 Arrowhead Dr
- 16094 Wimbleton Dr