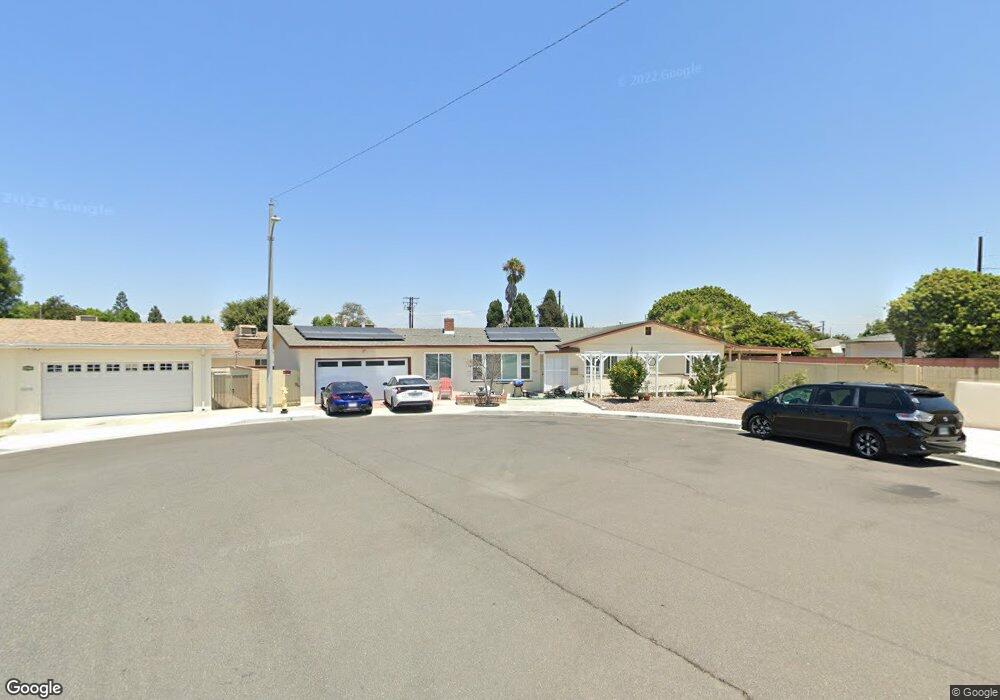
13862 Jasperson Way Westminster, CA 92683
Estimated Value: $978,000 - $1,388,132
3
Beds
3
Baths
2,490
Sq Ft
$445/Sq Ft
Est. Value
About This Home
This home is located at 13862 Jasperson Way, Westminster, CA 92683 and is currently estimated at $1,109,283, approximately $445 per square foot. 13862 Jasperson Way is a home located in Orange County with nearby schools including Schmitt Elementary, Johnson Middle, and Westminster High School.
Ownership History
Date
Name
Owned For
Owner Type
Purchase Details
Closed on
Dec 15, 2024
Sold by
Nikki Vo And Terry Diep Joint Living Tru and Diep Danny Khang
Bought by
13862 Jasperson Llc
Current Estimated Value
Purchase Details
Closed on
May 1, 2021
Sold by
Vo Nikki and Diep Terry
Bought by
Vo Nikki and Diep Terry
Purchase Details
Closed on
Sep 13, 2019
Sold by
Vo Nikki and Vo Nikki
Bought by
Vo Nikki
Home Financials for this Owner
Home Financials are based on the most recent Mortgage that was taken out on this home.
Interest Rate
3.56%
Purchase Details
Closed on
Dec 17, 2010
Sold by
Sch Llc
Bought by
Vo Nguyet T and Diep Tran Q
Purchase Details
Closed on
Nov 9, 2010
Sold by
Harmond Howard Arthur and Harmond Deborah L
Bought by
Sch Llc
Purchase Details
Closed on
Jan 9, 2007
Sold by
Harmond Howard Arthur and Harmond Deborah L
Bought by
Harmond Howard Arthur and Harmond Deborah L
Create a Home Valuation Report for This Property
The Home Valuation Report is an in-depth analysis detailing your home's value as well as a comparison with similar homes in the area
Home Values in the Area
Average Home Value in this Area
Purchase History
| Date | Buyer | Sale Price | Title Company |
|---|---|---|---|
| 13862 Jasperson Llc | -- | None Listed On Document | |
| Vo Nikki | -- | None Available | |
| Vo Nikki | -- | -- | |
| Vo Nguyet T | $395,000 | Advantage Title Inc | |
| Sch Llc | $108,000 | California Counties Title Co | |
| Harmond Howard Arthur | -- | None Available |
Source: Public Records
Mortgage History
| Date | Status | Borrower | Loan Amount |
|---|---|---|---|
| Previous Owner | Vo Nikki | -- |
Source: Public Records
Tax History Compared to Growth
Tax History
| Year | Tax Paid | Tax Assessment Tax Assessment Total Assessment is a certain percentage of the fair market value that is determined by local assessors to be the total taxable value of land and additions on the property. | Land | Improvement |
|---|---|---|---|---|
| 2025 | $9,769 | $1,265,000 | $770,156 | $494,844 |
| 2024 | $9,769 | $693,696 | $350,761 | $342,935 |
| 2023 | $6,457 | $473,948 | $343,884 | $130,064 |
| 2022 | $5,909 | $476,872 | $337,141 | $139,731 |
| 2021 | $5,764 | $467,522 | $330,530 | $136,992 |
| 2020 | $5,698 | $462,729 | $327,141 | $135,588 |
| 2019 | $5,635 | $453,656 | $320,726 | $132,930 |
| 2018 | $5,635 | $444,761 | $314,437 | $130,324 |
| 2017 | $5,427 | $436,041 | $308,272 | $127,769 |
| 2016 | $5,260 | $427,492 | $302,228 | $125,264 |
| 2015 | $5,172 | $421,071 | $297,688 | $123,383 |
| 2014 | $5,059 | $412,823 | $291,856 | $120,967 |
Source: Public Records
Map
Nearby Homes
- 7891 18th St
- 7811 24th St
- 7603 23rd St
- 7565 23rd St
- 13561 Arizona St
- 13532 Richardson Way
- 8181 20th St
- 8202 19th St
- 8192 18th St
- 7232 Wyoming St
- 13912 Cherry St
- 8197 Jasmine Ave
- 14352 Beach Blvd Unit 41
- 7161 Main St
- 13861 Pine St
- 7072 Spruce St
- 7541 Benton Ave
- 14260 Village Way Unit 23
- Plan 2 at Solara
- Plan 1 at Solara
- 13882 Jasperson Way
- 13871 Cardillo Dr
- 13881 Cardillo Dr
- 13861 Jasperson Way
- 13900 Jasperson Way
- 13841 Richardson Way
- 13881 Jasperson Way
- 7761 Leo Place
- 13891 Jasperson Way
- 7762 19th St
- 13912 Jasperson Way
- 13831 Richardson Way
- 13911 Cardillo Dr
- 7781 Leo Place
- 13911 Jasperson Way
- 7700 Wyoming St
- 13882 Arizona St
- 7772 19th St
- 13922 Jasperson Way