Estimated Value: $730,404 - $864,000
3
Beds
2
Baths
1,195
Sq Ft
$672/Sq Ft
Est. Value
About This Home
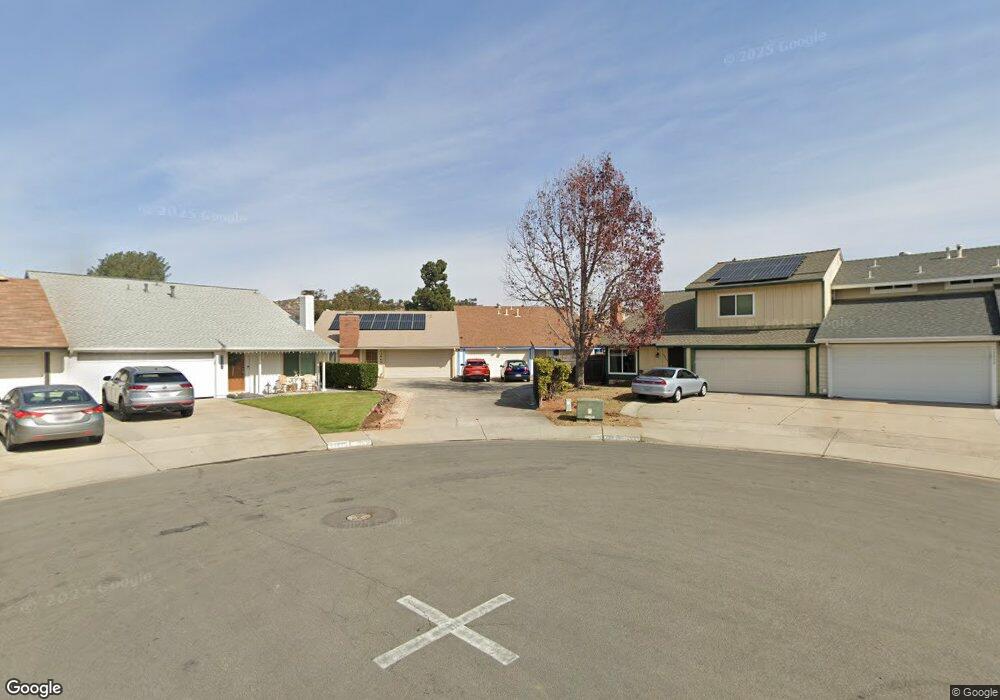
This home is located at 13867 Wayland Grove Ct, Poway, CA 92064 and is currently estimated at $803,351, approximately $672 per square foot. 13867 Wayland Grove Ct is a home located in San Diego County with nearby schools including Midland Elementary, Twin Peaks Middle, and Poway High.
Ownership History
Date
Name
Owned For
Owner Type
Purchase Details
Closed on
Dec 2, 2019
Sold by
Chang Pei Chen
Bought by
Chang Pei Chen and Tong Ho C
Current Estimated Value
Home Financials for this Owner
Home Financials are based on the most recent Mortgage that was taken out on this home.
Original Mortgage
$173,800
Outstanding Balance
$118,249
Interest Rate
3.7%
Mortgage Type
New Conventional
Estimated Equity
$685,102
Purchase Details
Closed on
Nov 2, 2002
Sold by
Tong Ho C and Chang Pei Chen
Bought by
Chang Pei Chen
Home Financials for this Owner
Home Financials are based on the most recent Mortgage that was taken out on this home.
Original Mortgage
$90,000
Interest Rate
5.31%
Purchase Details
Closed on
Jun 17, 1999
Sold by
Jarman Cheryl L
Bought by
Chang Pei Chen and Tong Ho C
Home Financials for this Owner
Home Financials are based on the most recent Mortgage that was taken out on this home.
Original Mortgage
$130,400
Interest Rate
7.24%
Purchase Details
Closed on
Jun 17, 1992
Purchase Details
Closed on
Jan 30, 1989
Create a Home Valuation Report for This Property
The Home Valuation Report is an in-depth analysis detailing your home's value as well as a comparison with similar homes in the area
Home Values in the Area
Average Home Value in this Area
Purchase History
| Date | Buyer | Sale Price | Title Company |
|---|---|---|---|
| Chang Pei Chen | -- | Western Resources Title | |
| Chang Pei Chen | -- | First American Title Co | |
| Chang Pei Chen | $163,000 | Chicago Title Co | |
| -- | $156,000 | -- | |
| -- | $141,300 | -- |
Source: Public Records
Mortgage History
| Date | Status | Borrower | Loan Amount |
|---|---|---|---|
| Open | Chang Pei Chen | $173,800 | |
| Closed | Chang Pei Chen | $90,000 | |
| Closed | Chang Pei Chen | $130,400 |
Source: Public Records
Tax History Compared to Growth
Tax History
| Year | Tax Paid | Tax Assessment Tax Assessment Total Assessment is a certain percentage of the fair market value that is determined by local assessors to be the total taxable value of land and additions on the property. | Land | Improvement |
|---|---|---|---|---|
| 2025 | $2,850 | $250,500 | $156,567 | $93,933 |
| 2024 | $2,850 | $245,590 | $153,498 | $92,092 |
| 2023 | $2,790 | $240,776 | $150,489 | $90,287 |
| 2022 | $2,745 | $236,056 | $147,539 | $88,517 |
| 2021 | $2,710 | $231,429 | $144,647 | $86,782 |
| 2020 | $2,675 | $229,057 | $143,164 | $85,893 |
| 2019 | $2,608 | $224,566 | $140,357 | $84,209 |
| 2018 | $2,536 | $220,163 | $137,605 | $82,558 |
| 2017 | $170 | $215,847 | $134,907 | $80,940 |
| 2016 | $2,421 | $211,615 | $132,262 | $79,353 |
| 2015 | $2,386 | $208,438 | $130,276 | $78,162 |
| 2014 | $2,332 | $204,356 | $127,725 | $76,631 |
Source: Public Records
Map
Nearby Homes
- 13654 Somerset Rd
- 13648 Putney Rd
- 13403 Little Dawn Ln
- 14082 Pomegranate Ave Unit 146
- 13918 Putney Rd
- 14152 Kendra Way
- 13544 Comuna Dr
- 13230 Johannesberg Way Unit 10
- 13958 Carriage Rd
- 13255 Evanston Dr
- 13760 Holly Oak Way
- 13770 Holly Oak Way
- 12939 Cree Ct
- 13056 Poway Rd
- 13765 Holly Oak Way
- 1/2 Poway Rd
- 13286 Creek Park Ln
- 13330 Canyon Back Ln
- 13306 Tawanka Dr
- 13329 Casa Vista St Unit 98
- 13869 Wayland Grove Ct
- 13859 Wayland Grove Ct
- 13861 Wayland Grove Ct
- 13875 Wayland Grove Ct
- 13877 Wayland Grove Ct
- 13868 Midgrove Ct
- 13866 Midgrove Ct
- 13860 Midgrove Ct
- 13870 Wayland Grove Ct
- 13868 Wayland Grove Ct
- 13853 Wayland Grove Ct
- 13873 Midgrove Ct
- 13875 Midgrove Ct
- 13852 Midgrove Ct
- 13850 Midgrove Ct
- 13860 Wayland Grove Ct
- 13862 Wayland Grove Ct
- 13854 Wayland Grove Ct
- 13852 Wayland Grove Ct
- 13843 Wayland Grove Ct