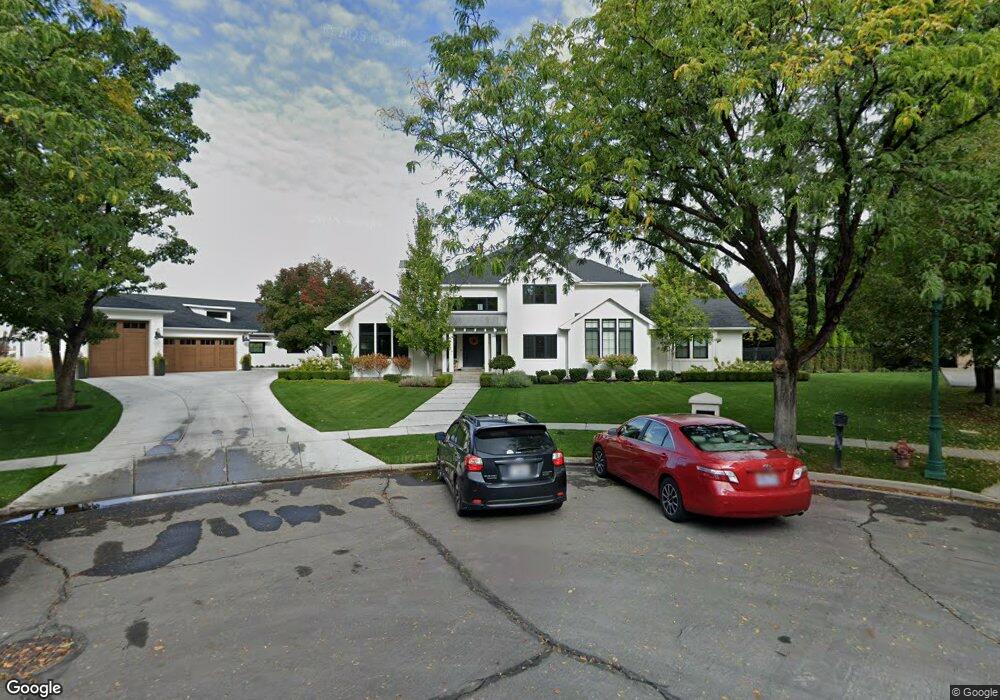
1387 N 430 E Orem, UT 84097
Windsor NeighborhoodEstimated Value: $2,846,283 - $3,228,000
8
Beds
6
Baths
9,044
Sq Ft
$336/Sq Ft
Est. Value
About This Home
This home is located at 1387 N 430 E, Orem, UT 84097 and is currently estimated at $3,037,142, approximately $335 per square foot. 1387 N 430 E is a home located in Utah County with nearby schools including Orchard Elementary School, Canyon View Junior High School, and Timpanogos High School.
Ownership History
Date
Name
Owned For
Owner Type
Purchase Details
Closed on
May 19, 2022
Sold by
Maricopa Trust
Bought by
Rasmussen David and Rasmussen Aubree
Current Estimated Value
Home Financials for this Owner
Home Financials are based on the most recent Mortgage that was taken out on this home.
Original Mortgage
$2,325,000
Outstanding Balance
$2,157,376
Interest Rate
3%
Mortgage Type
New Conventional
Estimated Equity
$879,766
Purchase Details
Closed on
Jul 31, 2018
Sold by
Rasmussen Dave R
Bought by
Bratsman Marc and Bratsman Trust
Purchase Details
Closed on
Nov 14, 2017
Sold by
Sorenson Keith S and Sandoval Christine B
Bought by
Rasmussen Dave R
Home Financials for this Owner
Home Financials are based on the most recent Mortgage that was taken out on this home.
Original Mortgage
$880,000
Interest Rate
3.62%
Mortgage Type
Adjustable Rate Mortgage/ARM
Create a Home Valuation Report for This Property
The Home Valuation Report is an in-depth analysis detailing your home's value as well as a comparison with similar homes in the area
Home Values in the Area
Average Home Value in this Area
Purchase History
| Date | Buyer | Sale Price | Title Company |
|---|---|---|---|
| Rasmussen David | -- | New Title Company Name | |
| Bratsman Marc | -- | Utah First Title Ins Ag | |
| Rasmussen Dave R | -- | Access Title Co |
Source: Public Records
Mortgage History
| Date | Status | Borrower | Loan Amount |
|---|---|---|---|
| Open | Rasmussen David | $2,325,000 | |
| Previous Owner | Rasmussen Dave R | $880,000 |
Source: Public Records
Tax History
| Year | Tax Paid | Tax Assessment Tax Assessment Total Assessment is a certain percentage of the fair market value that is determined by local assessors to be the total taxable value of land and additions on the property. | Land | Improvement |
|---|---|---|---|---|
| 2025 | $10,022 | $1,327,935 | -- | -- |
| 2024 | $10,022 | $1,225,450 | $0 | $0 |
| 2023 | $9,088 | $1,194,385 | $0 | $0 |
| 2022 | $10,766 | $2,457,300 | $636,800 | $1,820,500 |
| 2021 | $10,377 | $1,983,700 | $561,400 | $1,422,300 |
| 2020 | $9,983 | $1,876,800 | $468,600 | $1,408,200 |
| 2019 | $6,702 | $1,305,600 | $468,600 | $837,000 |
| 2018 | $6,555 | $1,219,100 | $468,600 | $750,500 |
| 2017 | $6,676 | $673,485 | $0 | $0 |
| 2016 | $7,240 | $673,485 | $0 | $0 |
| 2015 | $6,739 | $592,855 | $0 | $0 |
| 2014 | $6,613 | $579,105 | $0 | $0 |
Source: Public Records
Map
Nearby Homes
- 363 E 1395 N Unit 22
- 1371 N 330 E Unit 8
- 1480 N 430 E
- 372 E 1165 N
- 723 E 1450 N Unit 25
- 1636 N 160 E
- 1638 N 160 E
- 540 E Quail Rd
- 713 E 1450 N Unit 23
- 713 E 1500 St N Unit 19
- 710 E 1280 N
- 733 E 1450 N Unit 5
- 747 E 1500 N Unit 13
- 1366 N 750 E
- 1356 N 750 E Unit 11
- 1324 N 750 E Unit 3
- 1643 N Mountain Oaks Dr
- 976 N 560 E
- 917 N Garden Dr
- 695 E 1870 N
Your Personal Tour Guide
Ask me questions while you tour the home.