13872 Rembrandt Way Chantilly, VA 20151
Estimated Value: $1,070,338 - $1,157,000
5
Beds
4
Baths
5,400
Sq Ft
$205/Sq Ft
Est. Value
About This Home
This home is located at 13872 Rembrandt Way, Chantilly, VA 20151 and is currently estimated at $1,109,335, approximately $205 per square foot. 13872 Rembrandt Way is a home located in Fairfax County with nearby schools including Lees Corner Elementary, Franklin Middle, and Chantilly High School.
Ownership History
Date
Name
Owned For
Owner Type
Purchase Details
Closed on
Mar 21, 2019
Sold by
Chavali Srinivasa and Pasala Sreelatha
Bought by
Pasala Sreelatha
Current Estimated Value
Purchase Details
Closed on
Nov 11, 2015
Sold by
Chavali Srinivasa
Bought by
Chavali Srinivasa and Pasala Sreelatha
Purchase Details
Closed on
Jun 11, 2010
Sold by
Professional Foreclosure Corp and Choe Chang
Bought by
Pasala Sreelatha
Home Financials for this Owner
Home Financials are based on the most recent Mortgage that was taken out on this home.
Original Mortgage
$417,000
Interest Rate
5.03%
Mortgage Type
New Conventional
Purchase Details
Closed on
Sep 30, 2002
Sold by
Engle Homes Va Inc
Bought by
Choe Han M
Home Financials for this Owner
Home Financials are based on the most recent Mortgage that was taken out on this home.
Original Mortgage
$376,000
Interest Rate
6.25%
Purchase Details
Closed on
Mar 29, 2002
Sold by
Slf Chantilly Llc
Bought by
Engle Homes Va Inc
Create a Home Valuation Report for This Property
The Home Valuation Report is an in-depth analysis detailing your home's value as well as a comparison with similar homes in the area
Home Values in the Area
Average Home Value in this Area
Purchase History
| Date | Buyer | Sale Price | Title Company |
|---|---|---|---|
| Pasala Sreelatha | -- | None Available | |
| Chavali Srinivasa | -- | None Available | |
| Pasala Sreelatha | $535,500 | -- | |
| Choe Han M | $470,860 | -- | |
| Engle Homes Va Inc | $1,098,000 | -- |
Source: Public Records
Mortgage History
| Date | Status | Borrower | Loan Amount |
|---|---|---|---|
| Previous Owner | Pasala Sreelatha | $417,000 | |
| Previous Owner | Choe Han M | $376,000 |
Source: Public Records
Tax History Compared to Growth
Tax History
| Year | Tax Paid | Tax Assessment Tax Assessment Total Assessment is a certain percentage of the fair market value that is determined by local assessors to be the total taxable value of land and additions on the property. | Land | Improvement |
|---|---|---|---|---|
| 2025 | $11,423 | $1,079,240 | $310,000 | $769,240 |
| 2024 | $11,423 | $986,020 | $290,000 | $696,020 |
| 2023 | $10,540 | $933,940 | $290,000 | $643,940 |
| 2022 | $9,785 | $855,720 | $280,000 | $575,720 |
| 2021 | $9,584 | $816,700 | $280,000 | $536,700 |
| 2020 | $9,187 | $776,290 | $275,000 | $501,290 |
| 2019 | $9,084 | $767,580 | $275,000 | $492,580 |
| 2018 | $9,121 | $793,170 | $275,000 | $518,170 |
| 2017 | $8,763 | $754,790 | $275,000 | $479,790 |
| 2016 | $8,276 | $714,400 | $273,000 | $441,400 |
| 2015 | $7,740 | $693,540 | $265,000 | $428,540 |
| 2014 | $7,282 | $653,950 | $250,000 | $403,950 |
Source: Public Records
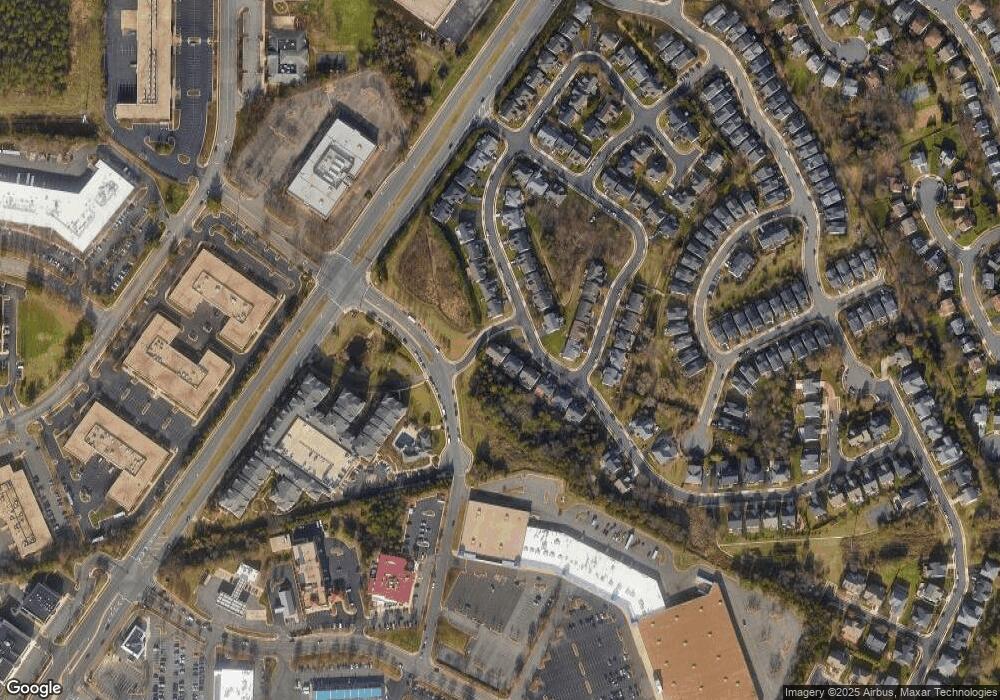
Map
Nearby Homes
- 4019 Kimberley Glen Ct
- 4127 Weeping Willow Ct Unit 142-A
- 13776 Flowing Brook Ct Unit 31-A
- 13723 Autumn Vale Ct
- 4119 Dawn Valley Ct
- 4131 Placid Lake Ct Unit 54E
- 3559 Plum Dale Dr
- 4006 Novar Dr
- 3350 Oakshade Ct
- 3321 Buckeye Ln
- 13371 Teaberry Ct
- 13711 Penwith Ct
- 13512 Apple Barrel Ct
- 13505 Coates Ln
- 3252 Tayloe Ct
- 3245 Kinross Cir
- 3711 Sumter Ct
- 14517 Braniff Cir
- 13110 Thompson Rd
- 4395 Peach Lily Ln Unit 311
- 13874 Rembrandt Way
- 13876 Rembrandt Way
- 13870 Rembrandt Way
- 13869 Rembrandt Way
- 13878 Rembrandt Way
- 13868 Rembrandt Way
- 13867 Rembrandt Way
- 3730 Renoir Terrace
- 13865 Rembrandt Way
- 3728 Renoir Terrace
- 13880 Rembrandt Way
- 13866 Rembrandt Way
- 13863 Rembrandt Way
- 3726 Renoir Terrace
- 13882 Rembrandt Way
- 13864 Rembrandt Way
- 3724 Renoir Terrace
- 13861 Rembrandt Way
- 3731 Renoir Terrace
- 3729 Renoir Terrace