Estimated Value: $853,000 - $977,000
3
Beds
3
Baths
2,000
Sq Ft
$463/Sq Ft
Est. Value
About This Home
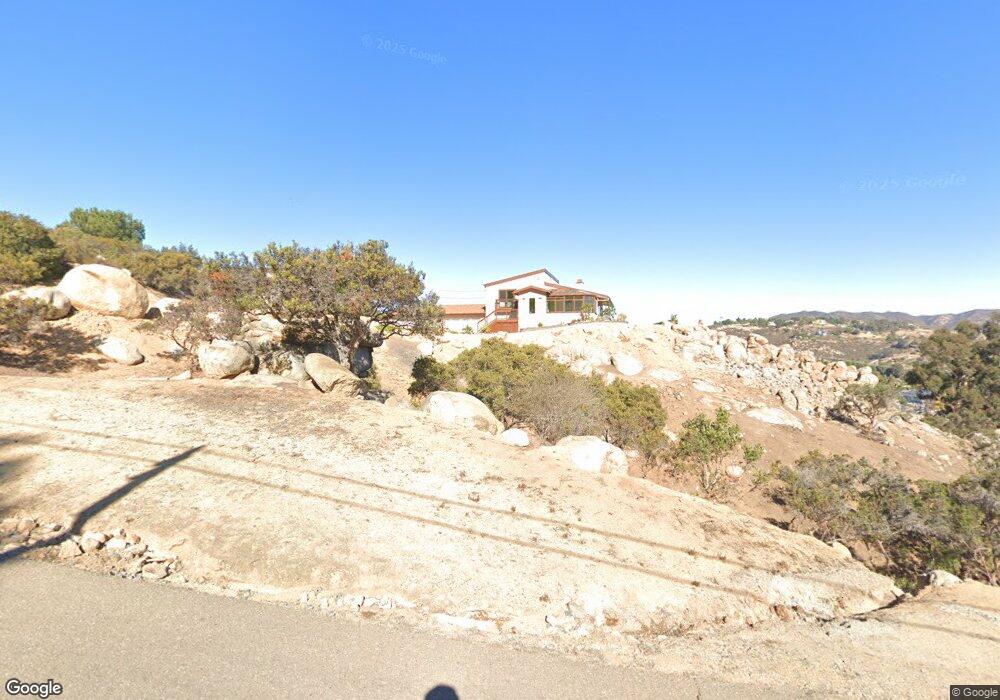
This home is located at 13880 Sage Mountain Ln, Jamul, CA 91935 and is currently estimated at $926,335, approximately $463 per square foot. 13880 Sage Mountain Ln is a home located in San Diego County with nearby schools including Jamul Primary School, Oak Grove Middle School, and Valhalla High.
Ownership History
Date
Name
Owned For
Owner Type
Purchase Details
Closed on
Sep 26, 2007
Sold by
Pendleton Daniel J and Pendleton Janet L
Bought by
Pendleton Daniel J and Pendleton Janet L
Current Estimated Value
Home Financials for this Owner
Home Financials are based on the most recent Mortgage that was taken out on this home.
Original Mortgage
$417,000
Outstanding Balance
$258,869
Interest Rate
6.46%
Mortgage Type
Stand Alone Refi Refinance Of Original Loan
Estimated Equity
$667,466
Purchase Details
Closed on
Nov 5, 2005
Sold by
Pendleton Daniel J and Pendleton Janet L
Bought by
Pendleton Daniel J and Pendleton Janet L
Purchase Details
Closed on
Sep 2, 1998
Sold by
Carolyn Opatry
Bought by
Pendleton Daniel J and Pendleton Janet L
Home Financials for this Owner
Home Financials are based on the most recent Mortgage that was taken out on this home.
Original Mortgage
$177,000
Interest Rate
6.89%
Purchase Details
Closed on
Mar 13, 1984
Create a Home Valuation Report for This Property
The Home Valuation Report is an in-depth analysis detailing your home's value as well as a comparison with similar homes in the area
Home Values in the Area
Average Home Value in this Area
Purchase History
| Date | Buyer | Sale Price | Title Company |
|---|---|---|---|
| Pendleton Daniel J | -- | Southland Title Company | |
| Pendleton Daniel J | -- | -- | |
| Pendleton Daniel J | -- | -- | |
| Pendleton Daniel J | $236,000 | First American Title | |
| -- | $36,100 | -- |
Source: Public Records
Mortgage History
| Date | Status | Borrower | Loan Amount |
|---|---|---|---|
| Open | Pendleton Daniel J | $417,000 | |
| Closed | Pendleton Daniel J | $177,000 | |
| Closed | Pendleton Daniel J | $35,400 |
Source: Public Records
Tax History
| Year | Tax Paid | Tax Assessment Tax Assessment Total Assessment is a certain percentage of the fair market value that is determined by local assessors to be the total taxable value of land and additions on the property. | Land | Improvement |
|---|---|---|---|---|
| 2025 | $5,550 | $466,300 | $156,761 | $309,539 |
| 2024 | $5,550 | $457,158 | $153,688 | $303,470 |
| 2023 | $5,448 | $448,195 | $150,675 | $297,520 |
| 2022 | $5,318 | $439,408 | $147,721 | $291,687 |
| 2021 | $5,208 | $430,793 | $144,825 | $285,968 |
| 2020 | $5,181 | $426,376 | $143,340 | $283,036 |
| 2019 | $5,135 | $418,017 | $140,530 | $277,487 |
| 2018 | $5,044 | $409,822 | $137,775 | $272,047 |
| 2017 | $790 | $401,787 | $135,074 | $266,713 |
| 2016 | $4,843 | $393,910 | $132,426 | $261,484 |
| 2015 | $4,791 | $387,994 | $130,437 | $257,557 |
| 2014 | $4,604 | $380,394 | $127,882 | $252,512 |
Source: Public Records
Map
Nearby Homes
- 13883 Sage Mountain Ln
- 13658 Sage Mountain Ln
- Montiel Truck Trails End Dr
- 13602 Indian Springs Dr
- 2816 Pioneer Way
- 89 Yacoo Ct Unit 89
- 000 Highway 94
- 13810 Calle Bueno Ganar
- 14085 Proctor Valley Rd
- 13840 Calle Bueno Ganar
- 13907 Maxfield Rd
- 13749 Calle Del Sol Unit Parcel B
- 13980 Lyons Valley Rd
- 3126 Reservoir Dr
- Deerhorn Echo Valley Rd Unit A72
- 3110 Stoney Oak Dr
- 2951-53 Miramontes Rd
- 3474 Trinas Way
- 3696 Alta Loma Dr
- 3206 Rancho Diego Cir
- 13561 Vista Sage Ln
- 13790 Sage Mountain Ln
- 13811 Sage Mountain Ln
- 13563 Vista Sage Ln
- 13726 Sage Mountain Ln
- 13773 Sage Mountain Ln
- 3009 Colina Verde Ln
- 13567 Vista Sage Ln
- 3010 Pioneer Way
- 13747 Sage Mountain Ln
- 13685 Sage Mountain Ln
- 13565 Vista Sage Ln
- 13710 Adele Ln
- 3006 Colina Verde Ln
- 13569 Vista Sage Ln
- 13990 Sprint Way
- 13703 Adele Ln
- 13571 Vista Sage Ln
- 13751 Sage Mountain Ln
- 13701 Adele Ln
Your Personal Tour Guide
Ask me questions while you tour the home.