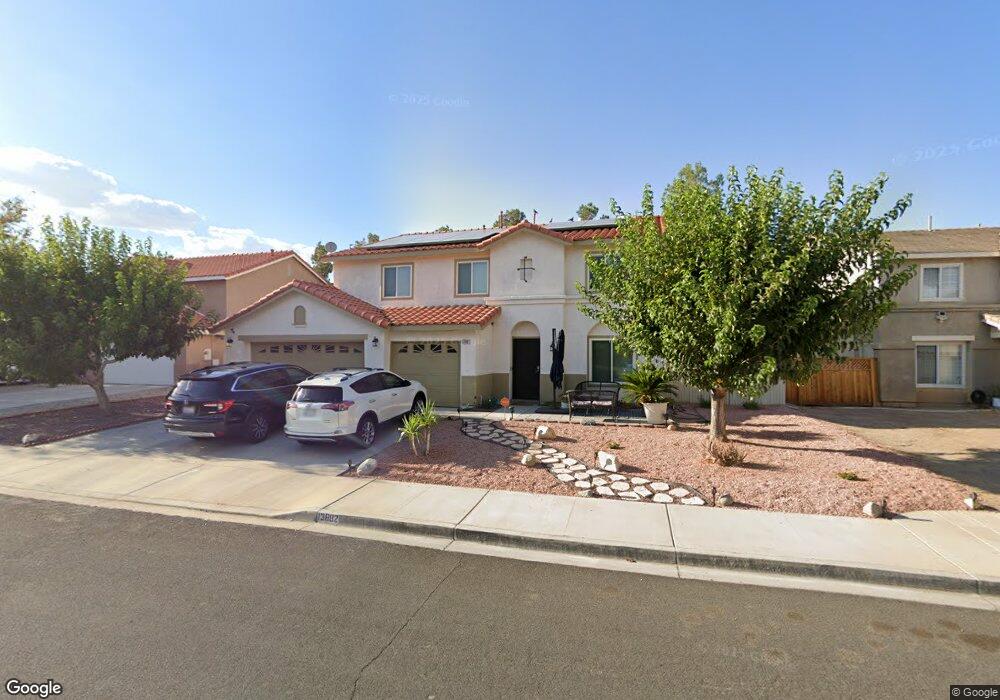
13882 Palomino Ct Victorville, CA 92394
Estimated Value: $462,000 - $529,000
4
Beds
3
Baths
2,792
Sq Ft
$172/Sq Ft
Est. Value
About This Home
This home is located at 13882 Palomino Ct, Victorville, CA 92394 and is currently estimated at $480,933, approximately $172 per square foot. 13882 Palomino Ct is a home located in San Bernardino County with nearby schools including Brentwood Elementary School, Village Elementary School, and Challenger School Of Sports And Fitness.
Ownership History
Date
Name
Owned For
Owner Type
Purchase Details
Closed on
Sep 3, 2025
Sold by
Jackson John Dwight and Jackson Vilma
Bought by
2025 John D Jackson And Vilma E Jackson Revoc and Jackson
Current Estimated Value
Purchase Details
Closed on
Dec 27, 1999
Sold by
Jackson John Dwight
Bought by
Jackson John Dwight and Jackson Vilma
Home Financials for this Owner
Home Financials are based on the most recent Mortgage that was taken out on this home.
Original Mortgage
$35,000
Interest Rate
7.68%
Mortgage Type
Stand Alone Second
Purchase Details
Closed on
Jan 12, 1999
Sold by
Jackson Vilma Edis
Bought by
Jackson John Dwight
Home Financials for this Owner
Home Financials are based on the most recent Mortgage that was taken out on this home.
Original Mortgage
$151,454
Interest Rate
6.73%
Mortgage Type
VA
Create a Home Valuation Report for This Property
The Home Valuation Report is an in-depth analysis detailing your home's value as well as a comparison with similar homes in the area
Home Values in the Area
Average Home Value in this Area
Purchase History
| Date | Buyer | Sale Price | Title Company |
|---|---|---|---|
| 2025 John D Jackson And Vilma E Jackson Revoc | -- | Chicago Title | |
| Jackson John Dwight | -- | Fidelity National Title | |
| Jackson John Dwight | -- | First American Title | |
| Jackson John Dwight | $147,500 | First American Title |
Source: Public Records
Mortgage History
| Date | Status | Borrower | Loan Amount |
|---|---|---|---|
| Previous Owner | Jackson John Dwight | $35,000 | |
| Previous Owner | Jackson John Dwight | $151,454 |
Source: Public Records
Tax History Compared to Growth
Tax History
| Year | Tax Paid | Tax Assessment Tax Assessment Total Assessment is a certain percentage of the fair market value that is determined by local assessors to be the total taxable value of land and additions on the property. | Land | Improvement |
|---|---|---|---|---|
| 2025 | $2,837 | $235,733 | $39,192 | $196,541 |
| 2024 | $2,837 | $231,111 | $38,424 | $192,687 |
| 2023 | $2,810 | $226,580 | $37,671 | $188,909 |
| 2022 | $2,764 | $222,137 | $36,932 | $185,205 |
| 2021 | $4,538 | $217,782 | $36,208 | $181,574 |
| 2020 | $4,490 | $215,549 | $35,837 | $179,712 |
| 2019 | $4,447 | $211,322 | $35,134 | $176,188 |
| 2018 | $4,616 | $207,178 | $34,445 | $172,733 |
| 2017 | $2,738 | $203,116 | $33,770 | $169,346 |
| 2016 | $2,684 | $199,133 | $33,108 | $166,025 |
| 2015 | $2,591 | $196,142 | $32,611 | $163,531 |
| 2014 | $2,770 | $192,300 | $31,972 | $160,328 |
Source: Public Records
Map
Nearby Homes
- 14780 Butterfly Ct
- 14766 Shetland Ct
- 15121 Sorrel Rd
- 13971 Clydesdale Run Ln
- 14117 Gopher Canyon Rd
- 14115 Buckskin Ct
- 13651 Gold Stone Place
- 13720 Dove Ct
- 14031 Horseshoe Way
- 14993 Brown Ln
- 13551 Western Meadows Ln
- 14577 Crossing Trail
- 15255 Sunray Ct
- 13986 Estate Way
- 14049 Estate Way
- 15203 Zircon Dr
- 14172 Paddock Rd
- 14304 Gray Fox Ln
- 14096 Estate Way
- Residence 1310 Plan at Dawson Pointe at West Creek
- 13870 Palomino Ct
- 13894 Palomino Ct
- 13904 Palomino Ct
- 13860 Palomino Ct
- 13879 Palomino Ct
- 13889 Palomino Ct
- 13883 Adelphia Ln
- 13875 Adelphia Ln
- 13869 Palomino Ct
- 14868 Arabian Run Ln
- 13891 Adelphia Ln
- 13916 Palomino Ct
- 13859 Palomino Ct
- 13899 Adelphia Ln
- 13873 Adelphia Ln
- 14856 Arabian Run Ln
- 13884 Lippazan Ct
- 13913 Adelphia Ln
- 13896 Lippazan Ct
- 13870 Lippazan Ct