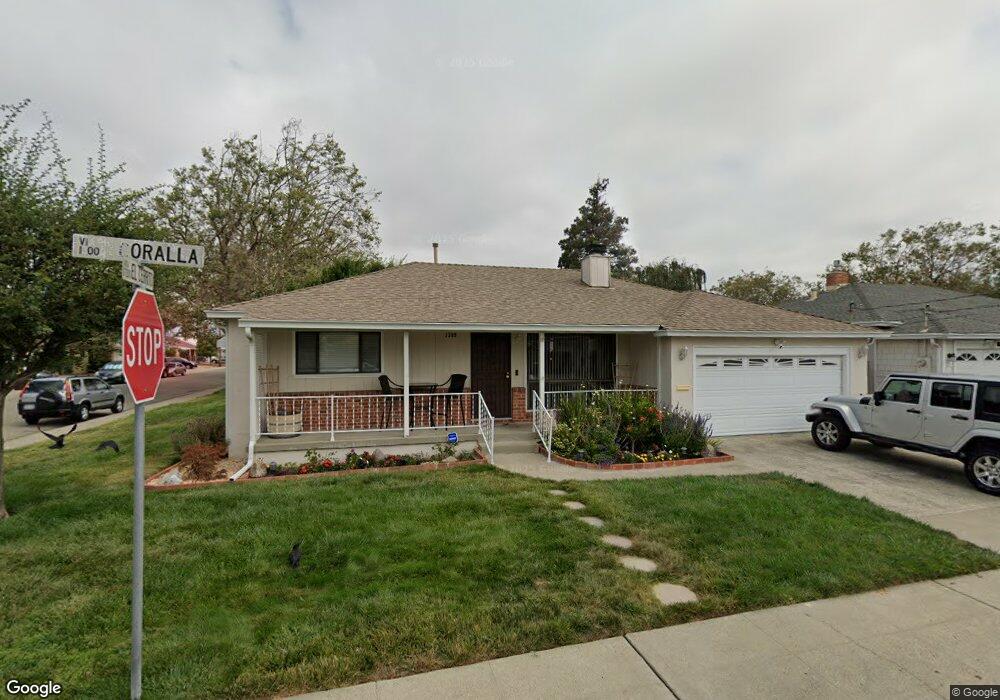
1389 Via Coralla San Lorenzo, CA 94580
Estimated Value: $598,000 - $814,000
3
Beds
1
Bath
1,042
Sq Ft
$707/Sq Ft
Est. Value
About This Home
This home is located at 1389 Via Coralla, San Lorenzo, CA 94580 and is currently estimated at $736,614, approximately $706 per square foot. 1389 Via Coralla is a home located in Alameda County with nearby schools including Del Rey Elementary School, Bohannon Middle School, and Arroyo High School.
Ownership History
Date
Name
Owned For
Owner Type
Purchase Details
Closed on
Oct 19, 2021
Sold by
Hayward Dennis Wayne and Hayward Family 2014 Revocable
Bought by
Hayward Dennis Wayne and Hayward Andrea Marie
Current Estimated Value
Home Financials for this Owner
Home Financials are based on the most recent Mortgage that was taken out on this home.
Original Mortgage
$377,000
Outstanding Balance
$344,827
Interest Rate
3.01%
Mortgage Type
New Conventional
Estimated Equity
$391,787
Purchase Details
Closed on
Sep 10, 2014
Sold by
Hayward Wayne F and Hayward Angelita
Bought by
Hayward Family 2014 Revocable Trust
Create a Home Valuation Report for This Property
The Home Valuation Report is an in-depth analysis detailing your home's value as well as a comparison with similar homes in the area
Home Values in the Area
Average Home Value in this Area
Purchase History
| Date | Buyer | Sale Price | Title Company |
|---|---|---|---|
| Hayward Dennis Wayne | $380,000 | North American Title Co Inc | |
| Hayward Family 2014 Revocable Trust | -- | None Available |
Source: Public Records
Mortgage History
| Date | Status | Borrower | Loan Amount |
|---|---|---|---|
| Open | Hayward Dennis Wayne | $377,000 |
Source: Public Records
Tax History Compared to Growth
Tax History
| Year | Tax Paid | Tax Assessment Tax Assessment Total Assessment is a certain percentage of the fair market value that is determined by local assessors to be the total taxable value of land and additions on the property. | Land | Improvement |
|---|---|---|---|---|
| 2025 | $5,604 | $413,011 | $133,367 | $279,644 |
| 2024 | $5,604 | $404,916 | $130,753 | $274,163 |
| 2023 | $5,583 | $396,976 | $128,189 | $268,787 |
| 2022 | $5,496 | $389,193 | $125,676 | $263,517 |
| 2021 | $1,474 | $60,046 | $37,600 | $29,446 |
| 2020 | $1,425 | $66,359 | $37,215 | $29,144 |
| 2019 | $1,405 | $65,057 | $36,485 | $28,572 |
| 2018 | $1,254 | $63,782 | $35,770 | $28,012 |
| 2017 | $1,202 | $62,531 | $35,068 | $27,463 |
| 2016 | $1,141 | $61,306 | $34,381 | $26,925 |
| 2015 | $1,112 | $60,384 | $33,864 | $26,520 |
| 2014 | $1,094 | $59,202 | $33,201 | $26,001 |
Source: Public Records
Map
Nearby Homes
- 17354 Via el Cerrito
- 1608 Keller Ave
- 1311 Via Manzanas
- 1867 Via Buena Vista
- 18005 Sunol Rd
- 1575 Via Lucas
- 18003 Incline Place
- 819 Bockman Rd
- 18018 Sahara Rd
- 17316 Via Flores
- 1766 Via Redondo
- 17347 Via Encinas
- 18251 Via Jose
- 16050 Via Olinda
- 17761 Via Arriba
- 1631 Via Ventana
- 16011 Via Conejo
- 1655 Via Escondido
- 0 E 14th St Unit 41059501
- 19150 Hesperian Blvd Unit 19
- 1367 Via Coralla
- 17278 Via el Cerrito
- 17272 Via el Cerrito
- 1351 Via Coralla
- 1390 Via Coralla
- 17276 Via San Ardo
- 17283 Via el Cerrito
- 1368 Via Coralla
- 17270 Via San Ardo
- 17277 Via el Cerrito
- 17266 Via el Cerrito
- 1352 Via Coralla
- 1402 Via Coralla
- 17312 Via el Cerrito
- 17271 Via el Cerrito
- 17264 Via San Ardo
- 17307 Via el Cerrito
- 17260 Via el Cerrito
- 17320 Via San Ardo
- 17288 Via la Jolla