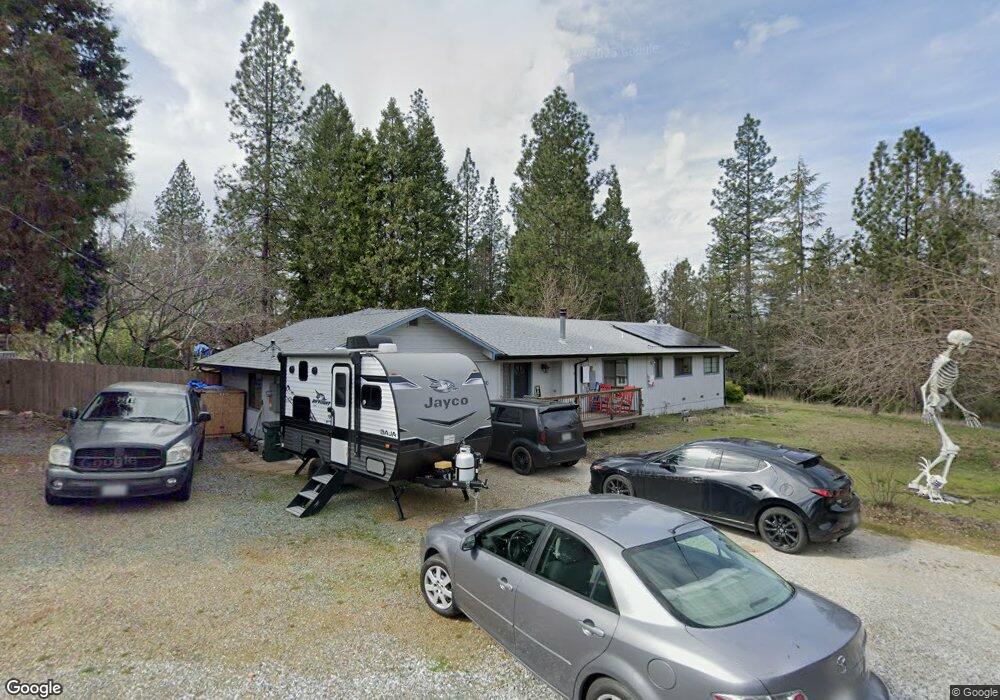
13895 Shadow Glen Ct Pine Grove, CA 95665
Estimated Value: $395,000 - $419,425
3
Beds
2
Baths
2,066
Sq Ft
$195/Sq Ft
Est. Value
About This Home
This home is located at 13895 Shadow Glen Ct, Pine Grove, CA 95665 and is currently estimated at $402,106, approximately $194 per square foot. 13895 Shadow Glen Ct is a home located in Amador County with nearby schools including Pine Grove Elementary School, Jackson Junior High School, and Argonaut High School.
Ownership History
Date
Name
Owned For
Owner Type
Purchase Details
Closed on
Dec 3, 2020
Sold by
Bartley Robert D
Bought by
Maciolek Samantha L and Pitt Timothy C
Current Estimated Value
Home Financials for this Owner
Home Financials are based on the most recent Mortgage that was taken out on this home.
Original Mortgage
$302,421
Outstanding Balance
$267,263
Interest Rate
2.8%
Mortgage Type
FHA
Estimated Equity
$134,843
Purchase Details
Closed on
Jan 21, 2011
Sold by
Bartley Virginia
Bought by
Bartley Robert D
Home Financials for this Owner
Home Financials are based on the most recent Mortgage that was taken out on this home.
Original Mortgage
$120,000
Interest Rate
4.82%
Mortgage Type
New Conventional
Create a Home Valuation Report for This Property
The Home Valuation Report is an in-depth analysis detailing your home's value as well as a comparison with similar homes in the area
Home Values in the Area
Average Home Value in this Area
Purchase History
| Date | Buyer | Sale Price | Title Company |
|---|---|---|---|
| Maciolek Samantha L | $308,000 | Placer Title Company | |
| Bartley Robert D | -- | Fidelity National Title Co |
Source: Public Records
Mortgage History
| Date | Status | Borrower | Loan Amount |
|---|---|---|---|
| Open | Maciolek Samantha L | $302,421 | |
| Previous Owner | Bartley Robert D | $120,000 |
Source: Public Records
Tax History
| Year | Tax Paid | Tax Assessment Tax Assessment Total Assessment is a certain percentage of the fair market value that is determined by local assessors to be the total taxable value of land and additions on the property. | Land | Improvement |
|---|---|---|---|---|
| 2025 | $3,438 | $333,387 | $81,181 | $252,206 |
| 2024 | $3,438 | $326,851 | $79,590 | $247,261 |
| 2023 | $3,371 | $320,443 | $78,030 | $242,413 |
| 2022 | $3,276 | $314,160 | $76,500 | $237,660 |
| 2021 | $3,215 | $308,000 | $75,000 | $233,000 |
| 2020 | $2,659 | $260,160 | $69,730 | $190,430 |
| 2019 | $2,607 | $255,060 | $68,363 | $186,697 |
| 2018 | $2,556 | $250,060 | $67,023 | $183,037 |
| 2017 | $2,507 | $245,158 | $65,709 | $179,449 |
| 2016 | $2,458 | $240,352 | $64,421 | $175,931 |
| 2015 | $2,422 | $236,743 | $63,454 | $173,289 |
| 2014 | $2,113 | $211,402 | $62,212 | $149,190 |
Source: Public Records
Map
Nearby Homes
- 14100 Greenleaf Ln
- 21580 Gayla Dr
- 22596 Alaire Ln
- 21550 California 88
- 14000 Brandon Rd
- 23055 Roden Ln
- 21000 French Gulch Rd
- 12880 Tabeau Ct
- 23420 Robin Rd
- 12615 Hilltop Ct
- 0 Old Giannini Ranch Rd
- 14955 Raven Rd
- 23568 Robin Rd
- 23201 Fortress Ct
- 20117 Neilson Rd
- 0 Red Corral Rd Unit 226006000
- 0 Red Corral Rd Unit 226006003
- 12325 Eldel Rd
- 0 Carson Dr Unit 225039139
- 0 Carson Dr Unit 225039251
- 22110 Meadowbrook Dr
- 13855 Shadow Glen Ct
- 13894 Shadow Glen Ct
- 22135 Meadowbrook Dr
- 13868 Shadow Glen Ct
- 22090 Meadowbrook Dr
- 13831 Shadow Glen Ct
- 13916 Dogwood Ct
- 13935 Dogwood Ct
- 22070 Meadowbrook Dr
- 22204 Meadowbrook Dr
- 13825 Shadow Glen Ct
- 22105 Meadowbrook Dr
- 22095 Meadowbrook Dr
- 22193 Valley View Ct
- 13945 Dogwood Ct
- 22201 Meadowbrook Dr
- 22190 Valley View Ct
- 13850 Shadow Glen Ct
- 13956 Dogwood Ct
Your Personal Tour Guide
Ask me questions while you tour the home.