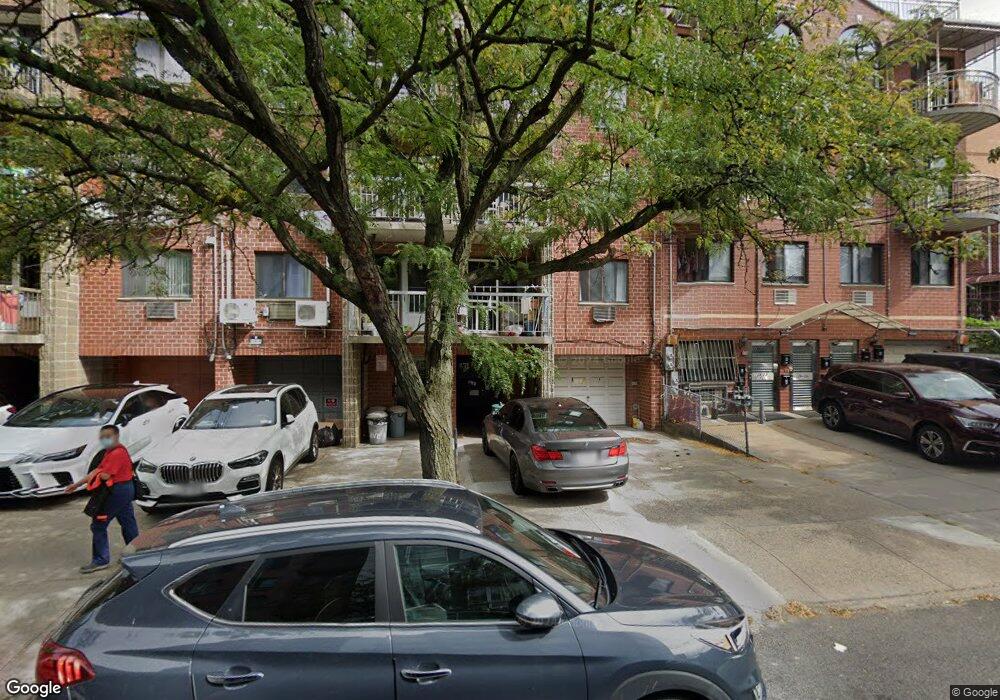
139-27 34th Ave Flushing, NY 11354
Flushing-Willets Point NeighborhoodEstimated Value: $352,242 - $640,000
1
Bed
1
Bath
381
Sq Ft
$1,263/Sq Ft
Est. Value
About This Home
This home is located at 139-27 34th Ave, Flushing, NY 11354 and is currently estimated at $481,311, approximately $1,263 per square foot. 139-27 34th Ave is a home located in Queens County with nearby schools including P.S. 214 Cadwallader Colden, Jhs 185 Edward Bleeker, and Flushing High School.
Ownership History
Date
Name
Owned For
Owner Type
Purchase Details
Closed on
Dec 13, 2018
Sold by
Lin Na and Zhang
Bought by
Chi Xiu Juan and Lin Guohua
Current Estimated Value
Home Financials for this Owner
Home Financials are based on the most recent Mortgage that was taken out on this home.
Original Mortgage
$300,000
Outstanding Balance
$261,214
Interest Rate
4.9%
Mortgage Type
New Conventional
Estimated Equity
$220,097
Purchase Details
Closed on
Oct 29, 2008
Sold by
Ge Cindy and Huang Yi
Bought by
Lin Na and Zhang
Home Financials for this Owner
Home Financials are based on the most recent Mortgage that was taken out on this home.
Original Mortgage
$196,000
Interest Rate
6.13%
Mortgage Type
Purchase Money Mortgage
Purchase Details
Closed on
Dec 13, 1994
Sold by
Yu Leepo C and Cheng Ta Pei
Bought by
Assoon Linda
Create a Home Valuation Report for This Property
The Home Valuation Report is an in-depth analysis detailing your home's value as well as a comparison with similar homes in the area
Home Values in the Area
Average Home Value in this Area
Purchase History
We collect this data history from publicly available records. To have your information removed, we recommend requesting removal directly through your county’s website.
| Date | Buyer | Sale Price | Title Company |
|---|---|---|---|
| Chi Xiu Juan | $505,000 | -- | |
| Chi Xiu Juan | $505,000 | -- | |
| Lin Na | $280,000 | -- | |
| Lin Na | $280,000 | -- | |
| Assoon Linda | $85,000 | First American Title Ins Co | |
| Assoon Linda | $85,000 | First American Title Ins Co |
Source: Public Records
Mortgage History
We collect this data history from publicly available records. To have your information removed, we recommend requesting removal directly through your county’s website.
| Date | Status | Borrower | Loan Amount |
|---|---|---|---|
| Open | Chi Xiu Juan | $300,000 | |
| Closed | Chi Xiu Juan | $300,000 | |
| Previous Owner | Lin Na | $196,000 |
Source: Public Records
Tax History
| Year | Tax Paid | Tax Assessment Tax Assessment Total Assessment is a certain percentage of the fair market value that is determined by local assessors to be the total taxable value of land and additions on the property. | Land | Improvement |
|---|---|---|---|---|
| 2026 | $6,220 | $52,048 | $3,646 | $48,402 |
| 2025 | $6,015 | $52,048 | $4,373 | $47,675 |
| 2024 | $6,036 | $50,432 | $5,082 | $45,350 |
| 2023 | $5,548 | $46,697 | $5,647 | $41,050 |
| 2022 | $4,234 | $51,476 | $6,150 | $45,326 |
| 2021 | $4,620 | $60,651 | $6,150 | $54,501 |
| 2020 | $4,670 | $58,883 | $6,150 | $52,733 |
| 2019 | $4,595 | $49,059 | $6,150 | $42,909 |
| 2018 | $4,273 | $35,921 | $5,404 | $30,517 |
| 2017 | $4,011 | $33,261 | $5,313 | $27,948 |
| 2016 | $3,666 | $33,261 | $5,313 | $27,948 |
| 2015 | $2,393 | $26,702 | $6,113 | $20,589 |
| 2014 | $2,393 | $25,292 | $6,096 | $19,196 |
Source: Public Records
Map
Nearby Homes
- 139-15 34th Ave Unit 4B
- 13911 34th Ave
- 139-19 34th Ave
- 13909 34th Ave
- 13907 34th Ave
- 14018 33rd Ave Unit 104
- 139-30 34th Ave Unit 3B
- 139-30 34th Ave Unit 4C
- 3343 Union St
- 138-35 39th Ave Unit 12L
- 138-35 39th Ave Unit 17H
- 138-35 39th Ave Unit 12F
- 138-35 39th Ave Unit 5L
- 138-35 39th Ave Unit 16A
- 3205 Linden Place #P7
- 138-35 39th Ave Unit 14M
- 138-35 39th Ave Unit 16A + 17A
- 138-35 39th Ave Unit 10H
- 138-35 39th Ave Unit 16K
- 140-03 32nd Ave
- 139-15 34th Ave Unit 1A
- 139-15 34th Ave Unit 3A
- 139-15 34th Ave Unit 2A
- 139-15 34th Ave
- 13915 34th Ave Unit 2A
- 13915 34th Ave Unit CU
- 13915 34th Ave Unit 2B
- 13915 34th Ave Unit 3B
- 13915 34th Ave Unit 1B
- 13915 34th Ave Unit 4A
- 13915 34th Ave Unit 4B
- 13915 34th Ave Unit 1A
- 13915 34th Ave Unit 3A
- 13915 34th Ave
- 139-15 34th Ave Unit Cu
- 139-15 34th Ave Unit 4A
- 13917 34th Ave Unit 104
- 13917 34th Ave Unit 103
- 13917 34th Ave Unit 102
- 13917 34th Ave Unit 101
Your Personal Tour Guide
Ask me questions while you tour the home.