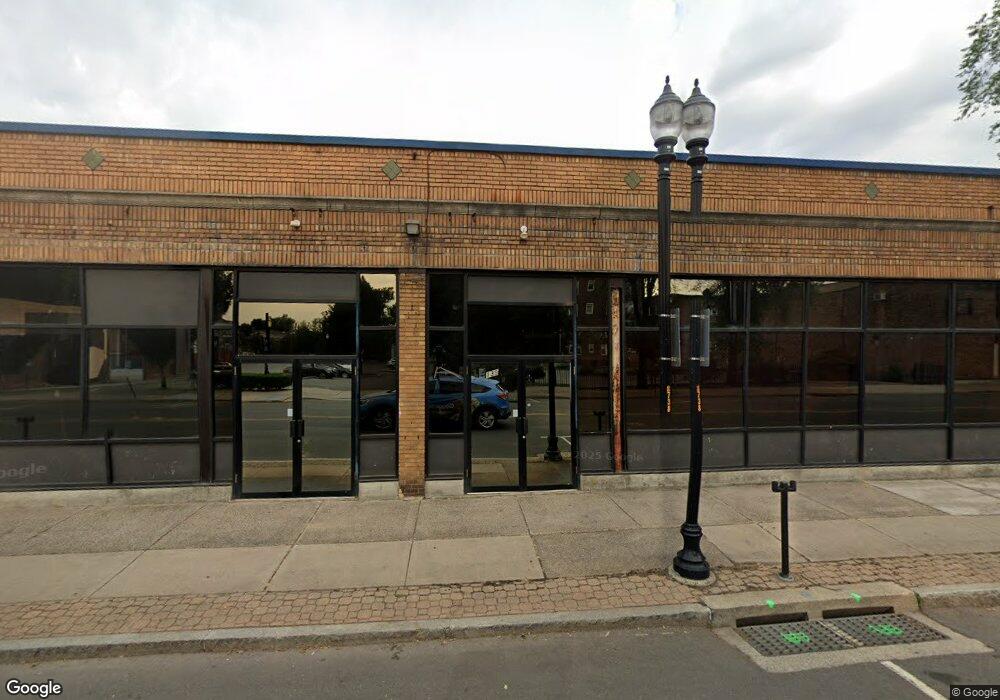
139 Arch St New Britain, CT 06051
Estimated Value: $538,902
--
Bed
1
Bath
11,387
Sq Ft
$47/Sq Ft
Est. Value
About This Home
This home is located at 139 Arch St, New Britain, CT 06051 and is currently priced at $538,902, approximately $47 per square foot. 139 Arch St is a home located in Hartford County with nearby schools including Vance School, Slade Middle School, and Mountain Laurel Sudbury School.
Ownership History
Date
Name
Owned For
Owner Type
Purchase Details
Closed on
Jul 21, 2006
Sold by
Ripper James F
Bought by
Popco Llc
Current Estimated Value
Home Financials for this Owner
Home Financials are based on the most recent Mortgage that was taken out on this home.
Original Mortgage
$650,000
Interest Rate
7.5%
Mortgage Type
Commercial
Purchase Details
Closed on
Mar 12, 1998
Sold by
Bwp Distributors Inc
Bought by
139 Arch St Assoc Llc
Create a Home Valuation Report for This Property
The Home Valuation Report is an in-depth analysis detailing your home's value as well as a comparison with similar homes in the area
Home Values in the Area
Average Home Value in this Area
Purchase History
| Date | Buyer | Sale Price | Title Company |
|---|---|---|---|
| Popco Llc | $185,000 | -- | |
| 139 Arch St Assoc Llc | $12,500 | -- |
Source: Public Records
Mortgage History
| Date | Status | Borrower | Loan Amount |
|---|---|---|---|
| Closed | 139 Arch St Assoc Llc | $650,000 |
Source: Public Records
Tax History Compared to Growth
Tax History
| Year | Tax Paid | Tax Assessment Tax Assessment Total Assessment is a certain percentage of the fair market value that is determined by local assessors to be the total taxable value of land and additions on the property. | Land | Improvement |
|---|---|---|---|---|
| 2025 | $9,506 | $242,620 | $41,860 | $200,760 |
| 2024 | $9,605 | $242,620 | $41,860 | $200,760 |
| 2023 | $9,287 | $242,620 | $41,860 | $200,760 |
| 2022 | $10,870 | $219,590 | $36,680 | $182,910 |
| 2021 | $10,870 | $219,590 | $36,680 | $182,910 |
| 2020 | $11,089 | $219,590 | $36,680 | $182,910 |
| 2019 | $11,089 | $219,590 | $36,680 | $182,910 |
| 2018 | $11,089 | $219,590 | $36,680 | $182,910 |
| 2017 | $10,630 | $210,490 | $34,930 | $175,560 |
| 2016 | $10,630 | $210,490 | $34,930 | $175,560 |
| 2015 | $10,314 | $210,490 | $34,930 | $175,560 |
| 2014 | $10,314 | $210,490 | $34,930 | $175,560 |
Source: Public Records
Map
Nearby Homes
- 42 Prospect St
- 60 Prospect St
- 32 W Pearl St
- 235 W Main St
- 14 Park Place Unit 4
- 45 Park Place Unit 205
- 239 Glen St Unit 2A
- 93 Winthrop St
- 300 W Main St
- 70 Monroe St
- 256 Hart St
- 18 Union St
- 270 Maple St
- 21 Trinity St Unit 23
- 402 Church St
- 86 North St
- 123 North St
- 320 Chestnut St
- 75 Clark St
- 66 Lincoln St
- 145 Arch St
- 161 Arch St
- 42 Prospect St Unit Prospect street
- 42 Prospect St Unit 1
- 50 Prospect St
- 56 Prospect St
- 34 Prospect St Unit 1
- 34 Prospect St Unit 2
- 168 Arch St Unit 2
- 168 Arch St Unit 28
- 168 Arch St
- 176 Arch St
- 68 Prospect St
- 28 Prospect St
- 74 Prospect St
- 73 Arch St
- 184 Arch St
- 35 Glen St Unit 34
- 35 Glen St Unit 41