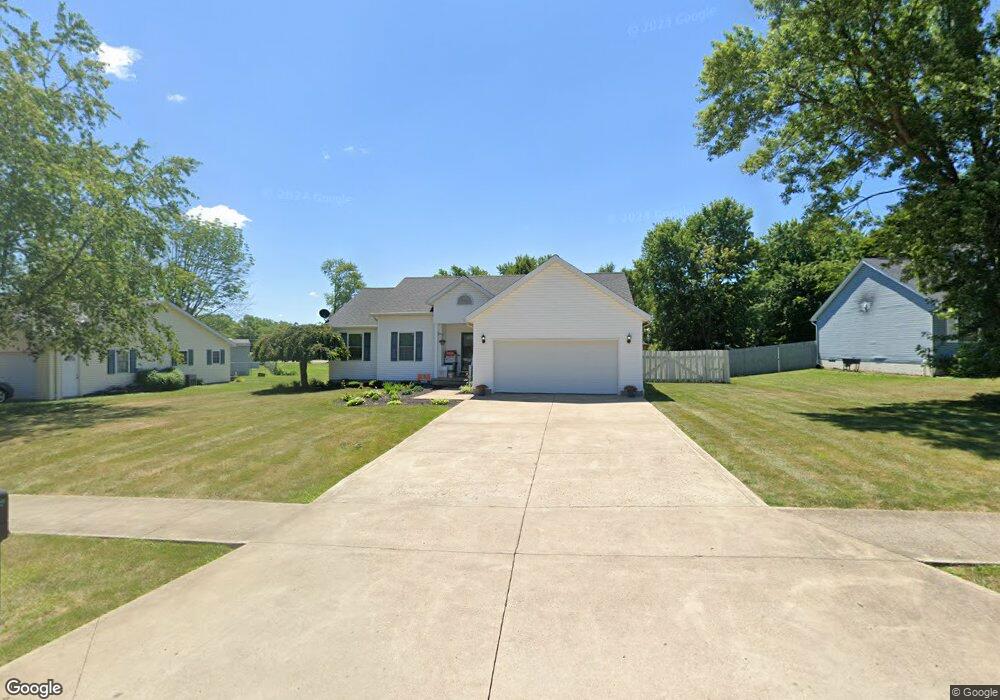
139 Belle Ave Ashland, OH 44805
Estimated Value: $223,952 - $271,000
3
Beds
2
Baths
1,489
Sq Ft
$172/Sq Ft
Est. Value
About This Home
This home is located at 139 Belle Ave, Ashland, OH 44805 and is currently estimated at $256,738, approximately $172 per square foot. 139 Belle Ave is a home located in Ashland County with nearby schools including Ashland High School, Ashland County Community Academy, and St. Edward Elementary School.
Ownership History
Date
Name
Owned For
Owner Type
Purchase Details
Closed on
Oct 30, 2017
Sold by
Brown Stephen G
Bought by
Morton Aaron S
Current Estimated Value
Home Financials for this Owner
Home Financials are based on the most recent Mortgage that was taken out on this home.
Original Mortgage
$151,210
Outstanding Balance
$124,834
Interest Rate
3.75%
Mortgage Type
FHA
Estimated Equity
$131,904
Purchase Details
Closed on
Mar 24, 2006
Sold by
Drugan Jesse L
Bought by
Brown Stephen G
Purchase Details
Closed on
Mar 2, 2004
Sold by
Merickel Elmer Dale
Bought by
Drugan Jesse L
Purchase Details
Closed on
Mar 4, 2002
Bought by
Merickel Elmer Dale
Create a Home Valuation Report for This Property
The Home Valuation Report is an in-depth analysis detailing your home's value as well as a comparison with similar homes in the area
Home Values in the Area
Average Home Value in this Area
Purchase History
| Date | Buyer | Sale Price | Title Company |
|---|---|---|---|
| Morton Aaron S | $154,000 | Ashland Title | |
| Brown Stephen G | $133,500 | -- | |
| Drugan Jesse L | $135,900 | -- | |
| Merickel Elmer Dale | -- | -- |
Source: Public Records
Mortgage History
| Date | Status | Borrower | Loan Amount |
|---|---|---|---|
| Open | Morton Aaron S | $151,210 |
Source: Public Records
Tax History
| Year | Tax Paid | Tax Assessment Tax Assessment Total Assessment is a certain percentage of the fair market value that is determined by local assessors to be the total taxable value of land and additions on the property. | Land | Improvement |
|---|---|---|---|---|
| 2025 | $2,075 | $60,100 | $9,250 | $50,850 |
| 2024 | $2,075 | $60,100 | $9,250 | $50,850 |
| 2023 | $2,075 | $60,100 | $9,250 | $50,850 |
| 2022 | $2,015 | $46,230 | $7,120 | $39,110 |
| 2021 | $2,023 | $46,230 | $7,120 | $39,110 |
| 2020 | $1,915 | $46,230 | $7,120 | $39,110 |
| 2019 | $1,696 | $37,870 | $8,130 | $29,740 |
| 2018 | $1,711 | $37,870 | $8,130 | $29,740 |
| 2017 | $1,717 | $37,870 | $8,130 | $29,740 |
| 2016 | $1,560 | $32,930 | $7,070 | $25,860 |
| 2015 | $1,546 | $32,930 | $7,070 | $25,860 |
| 2013 | $1,929 | $40,500 | $7,200 | $33,300 |
Source: Public Records
Map
Nearby Homes
- 1471 Troy Rd
- 1411 Orange Rd
- 917 Union St
- 237 E 9th St
- 1520 Orange Rd Unit 22
- 1520 Orange Rd
- 304 Prospect St
- 945 Virginia Ave
- 1218 Myers Ave
- 214 W 4th St
- 0 Virginia Ave Unit 230908
- 416-418 Carroll St
- 259 E 3rd St
- 318 Miller Rear St
- 318 Miller St
- 515 Sandusky St
- 64 Harold Dr
- 539 E 5th St
- 16 Terrace Dr
- 427 W Main St
Your Personal Tour Guide
Ask me questions while you tour the home.