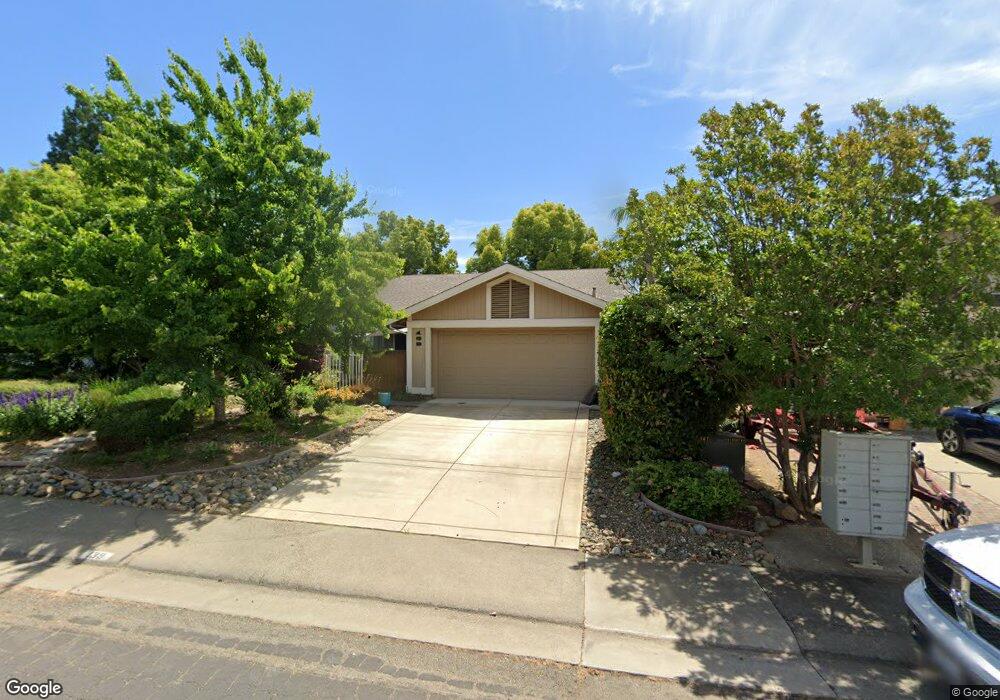
139 Blakeslee Way Folsom, CA 95630
Briggs Ranch NeighborhoodEstimated Value: $656,850 - $736,000
3
Beds
2
Baths
1,868
Sq Ft
$377/Sq Ft
Est. Value
About This Home
This home is located at 139 Blakeslee Way, Folsom, CA 95630 and is currently estimated at $703,963, approximately $376 per square foot. 139 Blakeslee Way is a home located in Sacramento County with nearby schools including Folsom Hills Elementary School, Folsom Middle School, and Vista Del Lago High School.
Ownership History
Date
Name
Owned For
Owner Type
Purchase Details
Closed on
Nov 19, 2014
Sold by
Blair Beth V and Buskirk Beth V
Bought by
Blair Beth V and Beth V Blair Revocable Living
Current Estimated Value
Purchase Details
Closed on
Nov 19, 2007
Sold by
Blair Beth V
Bought by
Beth V Blair Revocable Living Trust
Purchase Details
Closed on
Jun 4, 2002
Sold by
Blair Guy W
Bought by
Blair Beth V Buskirk
Purchase Details
Closed on
Jul 28, 1999
Sold by
Mary T Callagy Living Trust and Mary T
Bought by
Buskirk Beth V
Purchase Details
Closed on
Jul 5, 1994
Sold by
Callagy Mary T
Bought by
Callagy Mary T and Mary T Callagy Living Trust
Purchase Details
Closed on
Mar 21, 1994
Sold by
Fretwell David and Fretwell Shanon
Bought by
Callagy Mary T
Home Financials for this Owner
Home Financials are based on the most recent Mortgage that was taken out on this home.
Original Mortgage
$110,000
Interest Rate
7.15%
Create a Home Valuation Report for This Property
The Home Valuation Report is an in-depth analysis detailing your home's value as well as a comparison with similar homes in the area
Home Values in the Area
Average Home Value in this Area
Purchase History
| Date | Buyer | Sale Price | Title Company |
|---|---|---|---|
| Blair Beth V | -- | None Available | |
| Beth V Blair Revocable Living Trust | -- | None Available | |
| Blair Beth V | -- | None Available | |
| Blair Beth V Buskirk | -- | -- | |
| Buskirk Beth V | $193,000 | Financial Title Company | |
| Callagy Mary T | -- | -- | |
| Callagy Mary T | $187,000 | Placer Title Company |
Source: Public Records
Mortgage History
| Date | Status | Borrower | Loan Amount |
|---|---|---|---|
| Previous Owner | Callagy Mary T | $110,000 |
Source: Public Records
Tax History Compared to Growth
Tax History
| Year | Tax Paid | Tax Assessment Tax Assessment Total Assessment is a certain percentage of the fair market value that is determined by local assessors to be the total taxable value of land and additions on the property. | Land | Improvement |
|---|---|---|---|---|
| 2025 | $3,361 | $296,614 | $76,838 | $219,776 |
| 2024 | $3,361 | $290,799 | $75,332 | $215,467 |
| 2023 | $3,300 | $285,098 | $73,855 | $211,243 |
| 2022 | $3,251 | $279,508 | $72,407 | $207,101 |
| 2021 | $3,206 | $274,029 | $70,988 | $203,041 |
| 2020 | $3,167 | $271,221 | $70,261 | $200,960 |
| 2019 | $3,150 | $265,904 | $68,884 | $197,020 |
| 2018 | $3,077 | $260,691 | $67,534 | $193,157 |
| 2017 | $2,884 | $255,580 | $66,210 | $189,370 |
| 2016 | $2,873 | $250,569 | $64,912 | $185,657 |
| 2015 | $2,780 | $246,806 | $63,937 | $182,869 |
| 2014 | $2,643 | $241,972 | $62,685 | $179,287 |
Source: Public Records
Map
Nearby Homes
- 148 Oak Mill Rd
- 1522 Thurman Way
- 148 Big Valley Rd
- 1553 Bonanza Ln
- 1579 Bonanza Ln
- 1604 Thurman Way
- 1113 Kingfisher Cir
- 1752 Parkway Dr N
- 1376 Folsom Meadows Cir N
- 1645 Manasco Cir
- 106 Rhoades Way
- 193 Westbury Cir
- 1118 Buckbrush Dr
- 206 Rivage Cir
- 502 Monet Ln Unit 502
- 1195 Fergusen Way
- 1173 Fergusen Way
- 1557 Borrasca Dr
- 1480 Bicker Cir
- 1082 Smith Way
- 137 Blakeslee Dr
- 137 Blakeslee Way
- 141 Blakeslee Way
- 142 Witmer Dr
- 140 Witmer Dr
- 144 Witmer Dr
- 143 Blakeslee Way
- 135 Blakeslee Way
- 138 Witmer Dr
- 138 Blakeslee Way
- 140 Blakeslee Way
- 146 Witmer Dr
- 136 Blakeslee Way
- 136 Blakeslee Dr
- 136 Witmer Dr
- 145 Blakeslee Way
- 133 Blakeslee Way
- 133 Blakeslee Dr
- 134 Blakeslee Dr
- 142 Blakeslee Way