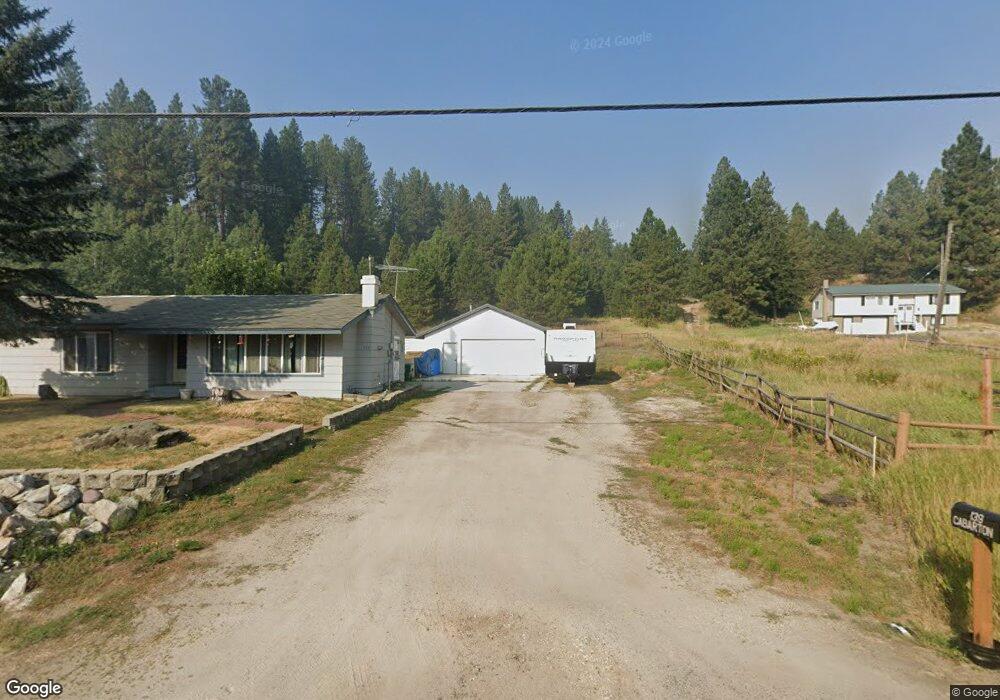
139 Cabarton Rd Cascade, ID 83611
Estimated Value: $404,907 - $505,000
3
Beds
2
Baths
1,286
Sq Ft
$349/Sq Ft
Est. Value
About This Home
This home is located at 139 Cabarton Rd, Cascade, ID 83611 and is currently estimated at $448,477, approximately $348 per square foot. 139 Cabarton Rd is a home located in Valley County with nearby schools including Cascade Elementary School, Cascade Junior/Senior High School, and ALZAR SCHOOL.
Ownership History
Date
Name
Owned For
Owner Type
Purchase Details
Closed on
Nov 22, 2021
Sold by
Barkell Malina E and Barkell Rodney
Bought by
Barkell Malina E
Current Estimated Value
Home Financials for this Owner
Home Financials are based on the most recent Mortgage that was taken out on this home.
Original Mortgage
$227,000
Outstanding Balance
$208,379
Interest Rate
3.12%
Mortgage Type
New Conventional
Estimated Equity
$240,098
Purchase Details
Closed on
Sep 20, 2019
Sold by
Barkell Malina E
Bought by
Barkell Malina E and Barkell Rodney
Home Financials for this Owner
Home Financials are based on the most recent Mortgage that was taken out on this home.
Original Mortgage
$172,000
Interest Rate
3.6%
Mortgage Type
New Conventional
Purchase Details
Closed on
Apr 21, 2014
Sold by
Barkell Rodney and Barkell Malina
Bought by
Barkell Malina E
Home Financials for this Owner
Home Financials are based on the most recent Mortgage that was taken out on this home.
Original Mortgage
$128,975
Interest Rate
4.12%
Mortgage Type
FHA
Create a Home Valuation Report for This Property
The Home Valuation Report is an in-depth analysis detailing your home's value as well as a comparison with similar homes in the area
Purchase History
| Date | Buyer | Sale Price | Title Company |
|---|---|---|---|
| Barkell Malina E | -- | Alliance Ttl Boise Productio | |
| Barkell Malina E | -- | Titleone Boise | |
| Barkell Malina E | -- | Amerititle Cascade |
Source: Public Records
Mortgage History
| Date | Status | Borrower | Loan Amount |
|---|---|---|---|
| Open | Barkell Malina E | $227,000 | |
| Closed | Barkell Malina E | $172,000 | |
| Closed | Barkell Malina E | $128,975 |
Source: Public Records
Tax History
| Year | Tax Paid | Tax Assessment Tax Assessment Total Assessment is a certain percentage of the fair market value that is determined by local assessors to be the total taxable value of land and additions on the property. | Land | Improvement |
|---|---|---|---|---|
| 2025 | $1,462 | $391,244 | $118,145 | $273,099 |
| 2023 | $1,462 | $398,103 | $119,326 | $278,777 |
| 2022 | $1,978 | $444,833 | $118,145 | $326,688 |
| 2021 | $1,466 | $265,761 | $61,396 | $204,365 |
| 2020 | $1,238 | $197,600 | $34,660 | $162,940 |
| 2019 | $1,058 | $144,933 | $26,416 | $118,517 |
| 2018 | $1,123 | $157,724 | $23,707 | $134,017 |
| 2017 | $1,195 | $159,488 | $23,953 | $135,535 |
| 2016 | $991 | $115,762 | $23,953 | $91,809 |
| 2015 | $986 | $115,777 | $0 | $0 |
| 2013 | -- | $94,606 | $0 | $0 |
Source: Public Records
Map
Nearby Homes
- 147 Cabarton Rd Unit Pt O & P
- 147 Cabarton Rd Unit O & P
- 147 Cabarton Rd
- 149 Cabarton Rd
- 131 Cabarton Rd
- 131 Cabarton Rd
- 133 Cabarton Rd
- 148 Cabarton Rd Unit R & S
- 148 Cabarton Rd
- 140 Cabarton Rd
- 127 Cabarton Rd
- 127 Cabarton Rd Unit L
- 0 Lot 1 Blk 2 Raven Loop Unit 98869102
- 0 Lot 2 Blk 2 Raven Loop
- 0 Lot 14 Blk 2 Raven Loop Unit 98869108
- 0 Lot 13 Blk 2 Raven Loop Unit 98869107
- 123 Cabarton Rd Unit J&K
- 123 Cabarton Rd
- 0 Lot 12 Blk 2 Raven Loop Unit 98869105
- 0 Lot 15 Blk 2 Raven Loop Unit 98869109
Your Personal Tour Guide
Ask me questions while you tour the home.