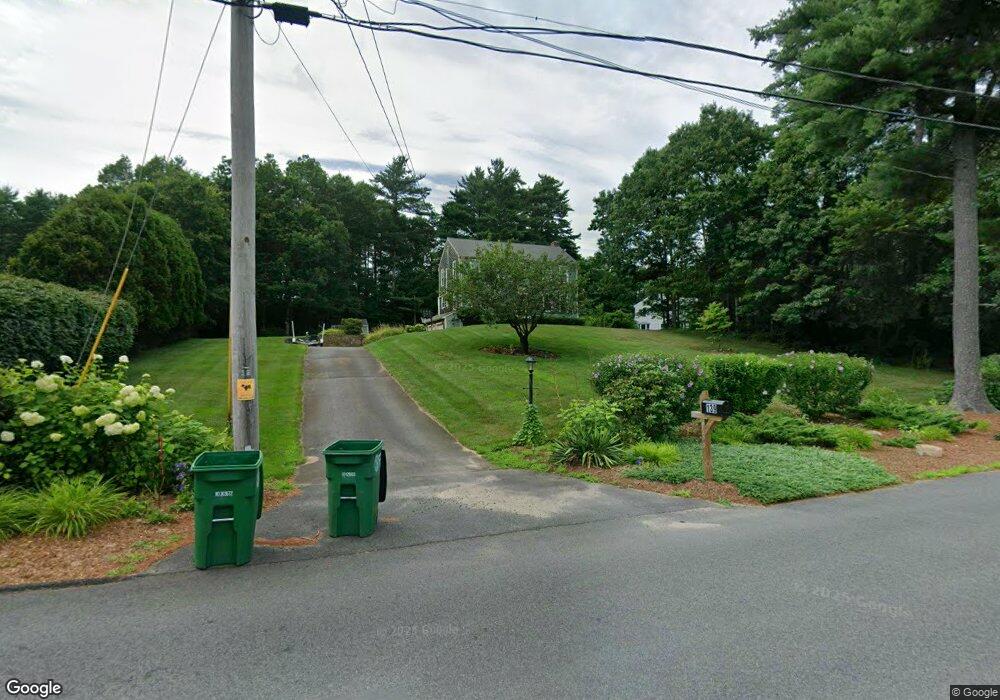
139 Chapel St Pembroke, MA 02359
Estimated Value: $670,368 - $717,000
3
Beds
3
Baths
1,728
Sq Ft
$397/Sq Ft
Est. Value
About This Home
This home is located at 139 Chapel St, Pembroke, MA 02359 and is currently estimated at $686,842, approximately $397 per square foot. 139 Chapel St is a home located in Plymouth County with nearby schools including Pembroke High School.
Ownership History
Date
Name
Owned For
Owner Type
Purchase Details
Closed on
Oct 28, 2005
Sold by
Sheppard Clifton W and Sheppard Corinne C
Bought by
Bolan Geoffrey S and Bolan Deborah W
Current Estimated Value
Home Financials for this Owner
Home Financials are based on the most recent Mortgage that was taken out on this home.
Original Mortgage
$307,500
Interest Rate
5.79%
Mortgage Type
Purchase Money Mortgage
Purchase Details
Closed on
Apr 3, 1989
Sold by
Lainoloc Rt
Bought by
Sheppard Clifton W
Create a Home Valuation Report for This Property
The Home Valuation Report is an in-depth analysis detailing your home's value as well as a comparison with similar homes in the area
Home Values in the Area
Average Home Value in this Area
Purchase History
| Date | Buyer | Sale Price | Title Company |
|---|---|---|---|
| Bolan Geoffrey S | $457,500 | -- | |
| Sheppard Clifton W | $188,000 | -- |
Source: Public Records
Mortgage History
| Date | Status | Borrower | Loan Amount |
|---|---|---|---|
| Open | Sheppard Clifton W | $295,000 | |
| Closed | Sheppard Clifton W | $40,000 | |
| Closed | Sheppard Clifton W | $307,500 | |
| Previous Owner | Sheppard Clifton W | $117,300 |
Source: Public Records
Tax History Compared to Growth
Tax History
| Year | Tax Paid | Tax Assessment Tax Assessment Total Assessment is a certain percentage of the fair market value that is determined by local assessors to be the total taxable value of land and additions on the property. | Land | Improvement |
|---|---|---|---|---|
| 2025 | $6,597 | $548,800 | $280,100 | $268,700 |
| 2024 | $6,529 | $542,700 | $275,300 | $267,400 |
| 2023 | $6,389 | $502,300 | $275,300 | $227,000 |
| 2022 | $6,048 | $427,400 | $225,300 | $202,100 |
| 2021 | $5,940 | $407,400 | $214,900 | $192,500 |
| 2020 | $5,708 | $393,900 | $205,300 | $188,600 |
| 2019 | $5,544 | $379,700 | $200,100 | $179,600 |
| 2018 | $5,264 | $353,500 | $185,300 | $168,200 |
| 2017 | $5,170 | $342,400 | $175,300 | $167,100 |
| 2016 | $5,086 | $333,300 | $165,300 | $168,000 |
| 2015 | $4,704 | $319,100 | $150,100 | $169,000 |
Source: Public Records
Map
Nearby Homes
- 96 Lake Shore Dr
- 61 Chapel St
- 202 Birch St
- 65 Hitty Tom Rd
- 9 Montclair Ave
- 345 Forest St
- 0 Wildwood Cir
- 15 Autumn Ave
- 7 Barbara Rd
- 600 Summer St Unit 6
- 27 Chestnut Rd
- 346 Summer St
- 234 Forest St
- 7 Green Holly Dr
- 64 Trout Farm Ln
- 6 Carriage Ln Unit 6
- 42 Trout Farm Ln Unit 2
- 21 Prince Way
- 0 Kingstown Way
- 17 Trout Farm Ln