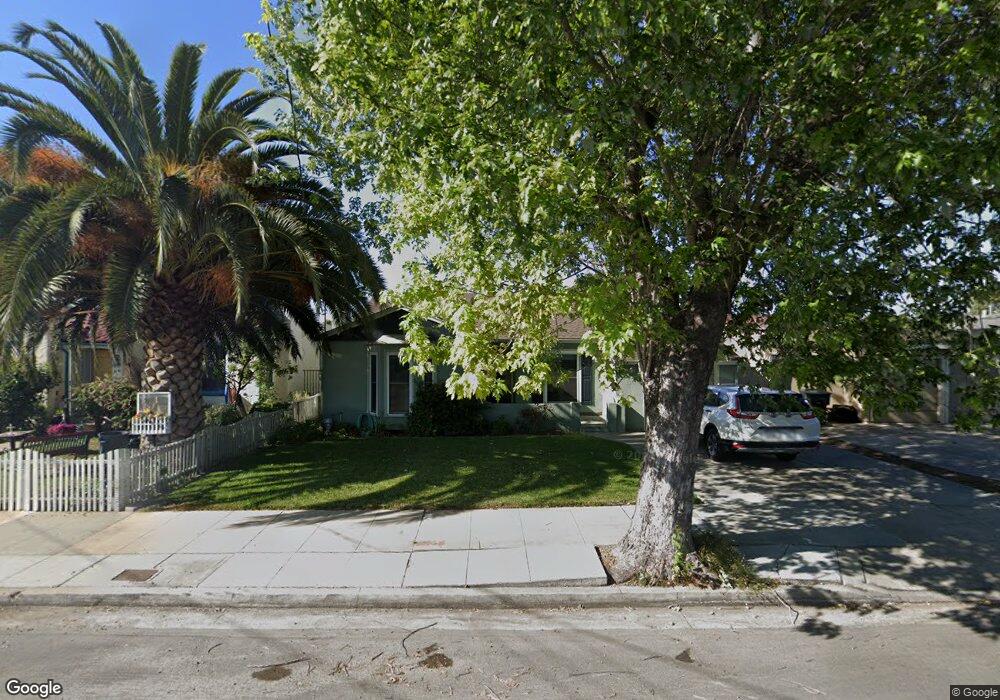
139 E Romie Ln Salinas, CA 93901
South Salinas NeighborhoodEstimated Value: $634,000 - $726,000
2
Beds
1
Bath
1,382
Sq Ft
$501/Sq Ft
Est. Value
About This Home
This home is located at 139 E Romie Ln, Salinas, CA 93901 and is currently estimated at $692,271, approximately $500 per square foot. 139 E Romie Ln is a home located in Monterey County with nearby schools including Lincoln Elementary School, Monterey Park Elementary School, and Mission Park Elementary School.
Ownership History
Date
Name
Owned For
Owner Type
Purchase Details
Closed on
Apr 30, 2013
Sold by
Cadei Diane P
Bought by
Cadei Diane P and The Diane P Cadei Living Trust
Current Estimated Value
Purchase Details
Closed on
Jun 16, 2009
Sold by
Duesdieker Melissa W
Bought by
Cadei Diane P
Home Financials for this Owner
Home Financials are based on the most recent Mortgage that was taken out on this home.
Original Mortgage
$220,000
Outstanding Balance
$139,448
Interest Rate
4.83%
Mortgage Type
Purchase Money Mortgage
Estimated Equity
$552,823
Purchase Details
Closed on
May 4, 2005
Sold by
Orida Priscilla Gin and Gin Gary D
Bought by
Duesdieker Melissa W
Home Financials for this Owner
Home Financials are based on the most recent Mortgage that was taken out on this home.
Original Mortgage
$418,000
Interest Rate
6.02%
Mortgage Type
Stand Alone First
Purchase Details
Closed on
Mar 16, 2002
Sold by
Gin Tommy M
Bought by
Gin Gin Lucy Fong Lucy Fong and Gin Orida Priscilla
Purchase Details
Closed on
Mar 12, 2002
Sold by
Gin Tommy M and Gin Lucy
Bought by
Gin Tommy M and Gin Lucy
Create a Home Valuation Report for This Property
The Home Valuation Report is an in-depth analysis detailing your home's value as well as a comparison with similar homes in the area
Home Values in the Area
Average Home Value in this Area
Purchase History
| Date | Buyer | Sale Price | Title Company |
|---|---|---|---|
| Cadei Diane P | -- | None Available | |
| Cadei Diane P | $325,000 | Old Republic Title Company | |
| Duesdieker Melissa W | $522,500 | Chicago Title | |
| Gin Gin Lucy Fong Lucy Fong | -- | -- | |
| Gin Tommy M | -- | -- |
Source: Public Records
Mortgage History
| Date | Status | Borrower | Loan Amount |
|---|---|---|---|
| Open | Cadei Diane P | $220,000 | |
| Previous Owner | Duesdieker Melissa W | $418,000 |
Source: Public Records
Tax History
| Year | Tax Paid | Tax Assessment Tax Assessment Total Assessment is a certain percentage of the fair market value that is determined by local assessors to be the total taxable value of land and additions on the property. | Land | Improvement |
|---|---|---|---|---|
| 2025 | $3,989 | $354,118 | $128,767 | $225,351 |
| 2024 | $3,989 | $347,176 | $126,243 | $220,933 |
| 2023 | $3,853 | $340,369 | $123,768 | $216,601 |
| 2022 | $3,707 | $333,696 | $121,342 | $212,354 |
| 2021 | $3,560 | $327,154 | $118,963 | $208,191 |
| 2020 | $3,461 | $323,801 | $117,744 | $206,057 |
| 2019 | $3,434 | $317,453 | $115,436 | $202,017 |
| 2018 | $3,389 | $311,229 | $113,173 | $198,056 |
| 2017 | $3,391 | $305,127 | $110,954 | $194,173 |
| 2016 | $3,392 | $299,145 | $108,779 | $190,366 |
| 2015 | $3,420 | $294,653 | $107,146 | $187,507 |
| 2014 | $3,189 | $288,882 | $105,048 | $183,834 |
Source: Public Records
Map
Nearby Homes
- 54 Katherine Ave
- 50 Katherine Ave
- 14 San Juan Dr
- 202 Pine St
- 247 Oak St
- 36 Pine St
- 333 Hawthorne St
- 612 Alameda Ave
- 57 Carmel Ave
- 323 San Miguel Ave
- 18 Chestnut St
- 1051 Padre Dr Unit 7
- 510 & 512 San Blanco Ct
- 207 Encinada Dr
- 1067 Padre Dr Unit 2
- 1067 Padre Dr Unit 1
- 1 Santa Lucia Ave
- 1056 Padre Dr Unit 4
- 118 Nissen Rd Unit 1
- 138 Nissen Rd Unit 1
- 133 E Romie Ln
- 938 California St
- 940 California St
- 930 California St
- 134 Hawthorne St
- 130 Hawthorne St
- 926 California St
- 125 E Romie Ln
- 126 Hawthorne St
- 144 Hawthorne St
- 138 E Romie Ln
- 120 Hawthorne St
- 144 E Romie Ln
- 130 E Romie Ln Unit D
- 130 E Romie Ln Unit C
- 146 E Romie Ln
- 150 E Romie Ln
- 116 Hawthorne St
- 939 California St
- 929 California St
Your Personal Tour Guide
Ask me questions while you tour the home.