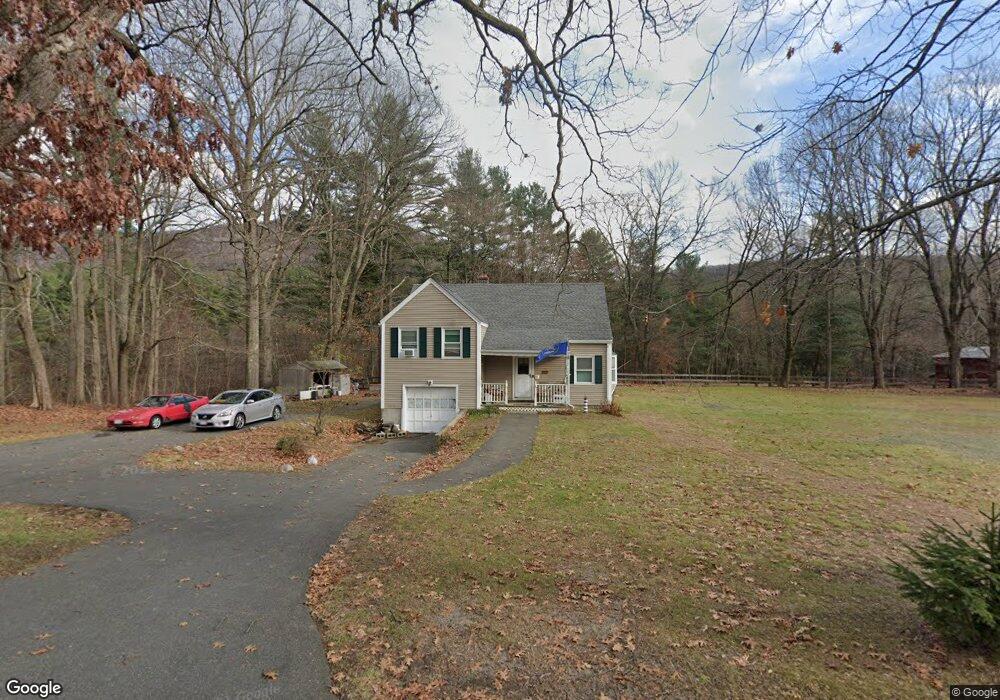
139 Hendrick St Easthampton, MA 01027
Estimated Value: $361,000 - $442,000
3
Beds
3
Baths
1,200
Sq Ft
$334/Sq Ft
Est. Value
About This Home
This home is located at 139 Hendrick St, Easthampton, MA 01027 and is currently estimated at $401,117, approximately $334 per square foot. 139 Hendrick St is a home located in Hampshire County with nearby schools including Easthampton High School, Tri-County Schools, and New England Adolescent Research Institute.
Ownership History
Date
Name
Owned For
Owner Type
Purchase Details
Closed on
Oct 28, 2020
Sold by
Read-Mcnally Caroline B
Bought by
Page Matthew J
Current Estimated Value
Home Financials for this Owner
Home Financials are based on the most recent Mortgage that was taken out on this home.
Original Mortgage
$75,000
Outstanding Balance
$66,739
Interest Rate
2.8%
Mortgage Type
New Conventional
Estimated Equity
$334,378
Create a Home Valuation Report for This Property
The Home Valuation Report is an in-depth analysis detailing your home's value as well as a comparison with similar homes in the area
Home Values in the Area
Average Home Value in this Area
Purchase History
| Date | Buyer | Sale Price | Title Company |
|---|---|---|---|
| Page Matthew J | $94,000 | None Available |
Source: Public Records
Mortgage History
| Date | Status | Borrower | Loan Amount |
|---|---|---|---|
| Open | Page Matthew J | $75,000 |
Source: Public Records
Tax History
| Year | Tax Paid | Tax Assessment Tax Assessment Total Assessment is a certain percentage of the fair market value that is determined by local assessors to be the total taxable value of land and additions on the property. | Land | Improvement |
|---|---|---|---|---|
| 2025 | $4,551 | $332,900 | $133,700 | $199,200 |
| 2024 | $4,392 | $323,900 | $129,800 | $194,100 |
| 2023 | $3,378 | $230,600 | $102,800 | $127,800 |
| 2022 | $3,812 | $230,600 | $102,800 | $127,800 |
| 2021 | $3,134 | $237,000 | $102,800 | $134,200 |
| 2020 | $4,095 | $230,600 | $102,800 | $127,800 |
| 2019 | $3,448 | $223,000 | $102,800 | $120,200 |
| 2018 | $3,309 | $206,800 | $96,800 | $110,000 |
| 2017 | $3,229 | $199,200 | $93,000 | $106,200 |
| 2016 | $3,106 | $199,200 | $93,000 | $106,200 |
| 2015 | $3,018 | $199,200 | $93,000 | $106,200 |
Source: Public Records
Map
Nearby Homes
Your Personal Tour Guide
Ask me questions while you tour the home.