Estimated Value: $317,000 - $366,000
3
Beds
3
Baths
1,410
Sq Ft
$242/Sq Ft
Est. Value
About This Home
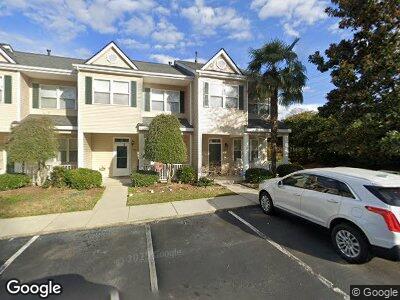
This home is located at 139 Licorice Dr, Apex, NC 27502 and is currently estimated at $341,252, approximately $242 per square foot. 139 Licorice Dr is a home located in Wake County with nearby schools including Baucom Elementary School, Apex Friendship Middle School, and Apex High School.
Ownership History
Date
Name
Owned For
Owner Type
Purchase Details
Closed on
Jun 15, 2011
Sold by
Brinson Kelli and Brinson Dave
Bought by
Almeida George and Almeida Lee A
Current Estimated Value
Home Financials for this Owner
Home Financials are based on the most recent Mortgage that was taken out on this home.
Original Mortgage
$115,200
Interest Rate
3.75%
Mortgage Type
New Conventional
Purchase Details
Closed on
Apr 27, 2006
Sold by
Vaickus Jennifer M
Bought by
Taylor Kelli B
Home Financials for this Owner
Home Financials are based on the most recent Mortgage that was taken out on this home.
Original Mortgage
$126,000
Interest Rate
6.33%
Mortgage Type
Unknown
Purchase Details
Closed on
Apr 30, 2001
Sold by
Pine Properties Inc
Bought by
Viackus Jennifer M
Home Financials for this Owner
Home Financials are based on the most recent Mortgage that was taken out on this home.
Original Mortgage
$95,600
Interest Rate
6.98%
Create a Home Valuation Report for This Property
The Home Valuation Report is an in-depth analysis detailing your home's value as well as a comparison with similar homes in the area
Home Values in the Area
Average Home Value in this Area
Purchase History
| Date | Buyer | Sale Price | Title Company |
|---|---|---|---|
| Almeida George | $128,000 | None Available | |
| Taylor Kelli B | $128,000 | None Available | |
| Viackus Jennifer M | $119,500 | -- |
Source: Public Records
Mortgage History
| Date | Status | Borrower | Loan Amount |
|---|---|---|---|
| Open | Almeida George V | $63,000 | |
| Closed | Almeida George | $115,200 | |
| Previous Owner | Taylor Kelli B | $126,000 | |
| Previous Owner | Vaickus Jennifer M | $91,520 | |
| Previous Owner | Viackus Jennifer M | $95,600 |
Source: Public Records
Tax History Compared to Growth
Tax History
| Year | Tax Paid | Tax Assessment Tax Assessment Total Assessment is a certain percentage of the fair market value that is determined by local assessors to be the total taxable value of land and additions on the property. | Land | Improvement |
|---|---|---|---|---|
| 2024 | $2,667 | $310,191 | $100,000 | $210,191 |
| 2023 | $2,047 | $184,802 | $45,000 | $139,802 |
| 2022 | $1,923 | $184,802 | $45,000 | $139,802 |
| 2021 | $1,850 | $184,802 | $45,000 | $139,802 |
| 2020 | $1,831 | $184,802 | $45,000 | $139,802 |
| 2019 | $1,573 | $136,779 | $30,000 | $106,779 |
| 2018 | $1,483 | $136,779 | $30,000 | $106,779 |
| 2017 | $1,381 | $136,779 | $30,000 | $106,779 |
| 2016 | $1,361 | $136,779 | $30,000 | $106,779 |
| 2015 | $1,384 | $135,778 | $28,000 | $107,778 |
| 2014 | $1,334 | $135,778 | $28,000 | $107,778 |
Source: Public Records
Map
Nearby Homes
- 204 Sugarland Dr
- 1614 Brussels Dr
- 1403 Chipping Dr
- 211 Milky Way Dr
- 1466 Salem Creek Dr
- 1429 Wragby Ln
- 1701 Bodwin Ln
- 1458 Wragby Ln
- 508 2nd St
- 206 Justice Heights St
- 1102 Whiston Dr
- 116 Anterbury Dr
- 0 James St Unit 10076799
- 0 Jb Morgan Rd Unit 10051948
- 1840 Flint Valley Ln
- 205 W Moore St
- 112 Homegate Cir
- 1557 Tice Hurst Ln
- 109 Homegate Cir
- 345 Anterbury Dr
- 139 Licorice Dr
- 131 Licorice Dr
- 136 Licorice Dr
- 138 Licorice Dr
- 134 Licorice Dr
- 132 Licorice Dr
- 130 Licorice Dr
- 128 Licorice Dr
- 126 Licorice Dr
- 124 Licorice Dr
- 105 Licorice Dr
- 122 Licorice Dr
- 103 Licorice Dr
- 101 Sugarland Dr
- 120 Licorice Dr
- 109 Sugarland Dr
- 103 Sugarland Dr
- 108 Licorice Dr
- 106 Licorice Dr
- 104 Licorice Dr